


CASIO
6-11
⇒
w(Draw)
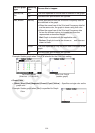
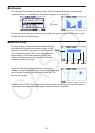
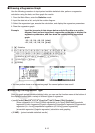
The display screen appears as shown above before the graph is drawn. At this point, you can
change the Start and Width values.
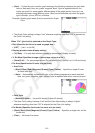
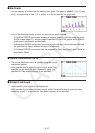
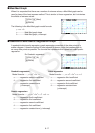
k Displaying the Calculation Results of a Drawn Single-Variable Graph
Single-variable statistics can be expressed as both graphs
and parameter values. When these graphs are displayed,
the single-variable calculation results appear as shown to
the right when you press 1(1-VAR).
• Use c to scroll the list so you can view the items that run off the bottom of the screen.
The following describes the meaning of each of the parameters.
¯ x .................. mean
Σ
x ................ sum
Σ
x
2
............... sum of squares
σ
x
................. population standard
deviation
s
x
................. sample standard
deviation
n ..................number of data items
minX ............. minimum
Q1 ................ first quartile
Med .............. median
Q3 ................ third quartile
maxX ............ maximum
Mod .............. mode
Mod:
n ..........number of data mode items
Mod:F ..........data mode frequency
• Press 6(DRAW) to return to the original single-variable statistical graph.
• When Mod has multiple solutions, they are all displayed.
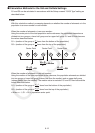
• You can use the Setup screen’s “Q1Q3 Type” setting to select either “Std” (standard
calculation) or “OnData” (French calculation) for the Q1 and Q3 calculation mode.
For details about calculation methods while “Std” or “OnData” is selected, see “Calculation
Methods for the Std and OnData Settings” below.