


CASIO
6-27
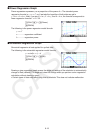
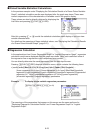
k Normal Probability Distribution Calculation
You can calculate normal probability distributions for single-variable statistics with the
Run-Matrix mode.
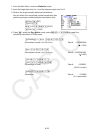
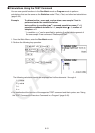
Press K6( g) 3(PROB) 6( g) to display a function menu, which contains the following
items.
• { P( } / { Q( } / { R( } ... obtains normal probability {P(
t )}/{Q( t )}/{R( t )} value
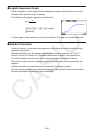
• {
t ( } ... {obtains normalized variate t ( x ) value}
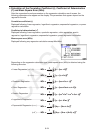
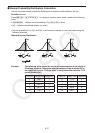
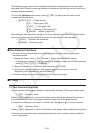
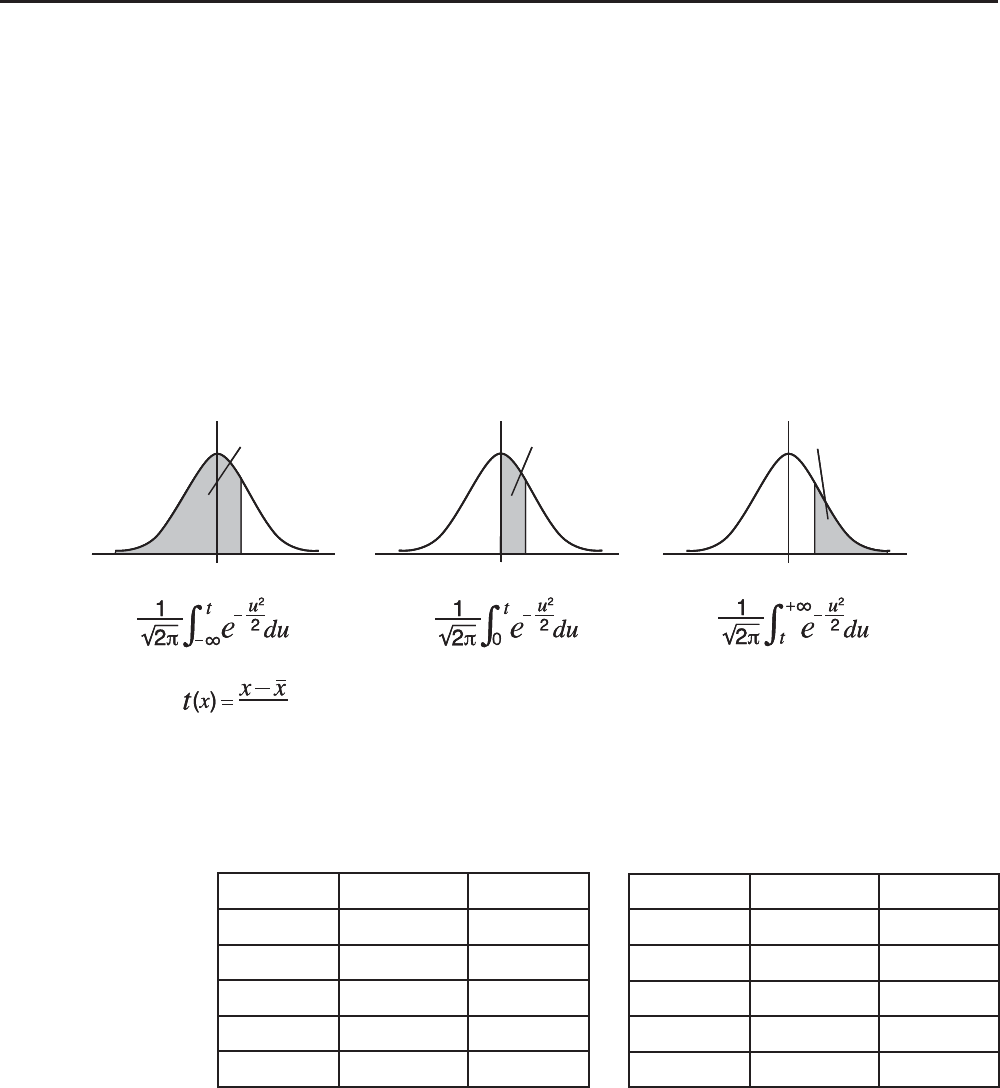
• Normal probability P(
t ), Q( t ), and R( t ), and normalized variate t ( x ) are calculated using the
following formulas.
Standard Normal Distribution
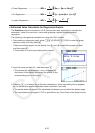
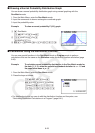
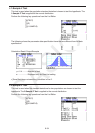
Example The following table shows the results of measurements of the height of
20 college students. Determine what percentage of the students fall in
the range 160.5 cm to 175.5 cm. Also, in what percentile does the 175.5
cm tall student fall?
Class no. Height (cm) Frequency
1 158.5 1
2 160.5 1
3 163.3 2
4 167.5 2
5 170.2 3
P
(
t
)Q
(
t
)R
(
t
)
tt t
00 0
σ
x
P
(
t
)Q
(
t
)R
(
t
)
tt t
00 0
σ
x
Class no. Height (cm) Frequency
6 173.3 4
7 175.5 2
8 178.6 2
9 180.4 2
10 186.7 1