


CASIO
5-29
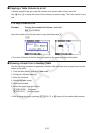
u To graph a function using copy and paste
1. Copy the function you want to graph to the clipboard.
2. From the Main Menu, enter the Graph mode.
3. On the Setup screen, change the “Dual Screen” setting to “Off”.
4. Configure V-Window settings.
5. Draw the graph.
6. Paste the expression.
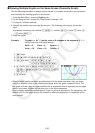
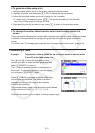
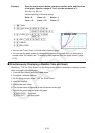
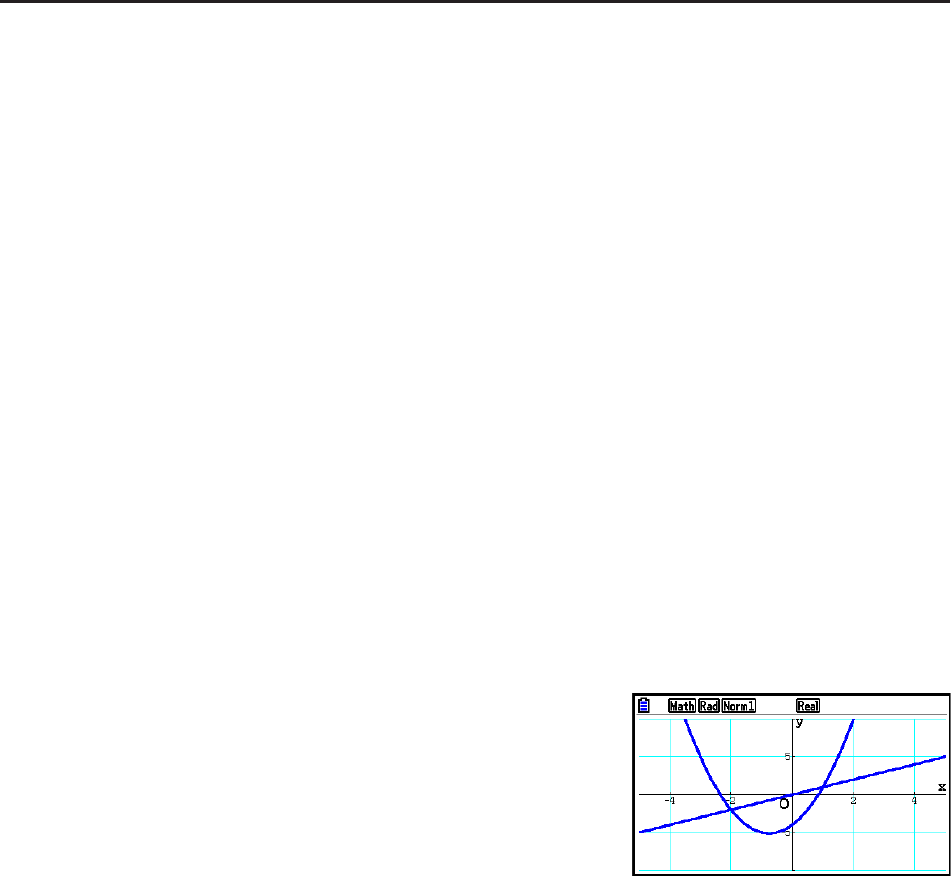
Example While the graph of
y = 2 x
2
+ 3 x – 4 is currently displayed, to paste the
previously copied function Y=X from the clipboard
Use the following V-Window settings.
Xmin = –5, Xmax = 5, Xscale = 2
Ymin = –10, Ymax = 10, Yscale = 5
1 m Run-Matrix
a-(Y)!.(=)v
!i(CLIP)ddd1(COPY)
2 mGraph
3 !m(SET UP)cccc3(Off)J
4 !3(V-WIN) -fwfwcwc
-bawbawfwJ
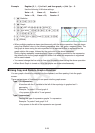
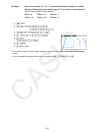
5 3(TYPE) 1(Y=) cvx+dv-ew
6(DRAW)
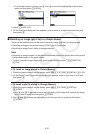
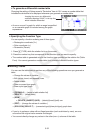
6 !j(PASTE)
• A graph drawn as the result of a paste operation is drawn with blue line color and normal line
style. You can change the line color and line style on the graph screen only. For details, see
“Changing Graph Properties” (page 5-15).
• Paste is supported only when “Off” is selected for the “Dual Screen” setting on the Setup
screen.
• Though there is no limit on the number of graphs you can draw by pasting a function, the
total number of graphs supported by trace and other functions is 30 (number of graphs
drawn using expression number 1 to 20, plus graphs drawn using pasted functions).
• For the graph of a pasted function, the graph expression that appears when using trace or
other functions is displayed in the format: Y= expression.
• Re-executing a draw without clearing graph screen memory will redraw all the graphs,
including those produced by pasting functions.