


CASIO
9-32
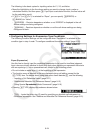
When drawing a pie chart or bar graph, only the Color Link settings (page 6-3) are different
from the settings in the Statistics mode and Spreadsheet mode.
For this
graph
type:
Selecting
this for
Color Link:
Causes this to happen:
Pie Category Of the data being used to draw the graph, the text color of the
cells in the range specified by the StatGraph screen “Category”
setting is reflected in the graph.
Data Of the data being used to draw the graph, the text color of the
cells in the range specified by the StatGraph screen “Data” setting
is reflected in the graph.
Off The text color of the data being used to draw the graph is ignored.
Bar Category Same as the pie chart, above.
Data Of the data being used to draw the graph, the text colors of the
cells in the range specified by the StatGraph screen “Data1”,
“Data2”, and “Data3” settings are reflected in the graph.
Off Same as the pie chart, above.
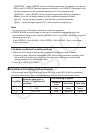
• When “Pie” is selected as the Graph Type, the “Pie Area” setting is always “Link” whenever
anything other than “Off” is selected for the “Color Link” setting.
• When “Bar” is selected as the Graph Type, the “Data1 Area”, “Data1 Border”, “Data2 Area”,
“Data2 Border”, “Data3 Area”, and “Data3 Border” settings are always “Link” whenever
anything other than “Off” is selected for the “Color Link” setting.
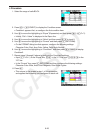
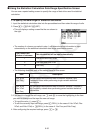
u Graphing examples using Color Link
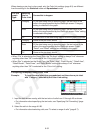
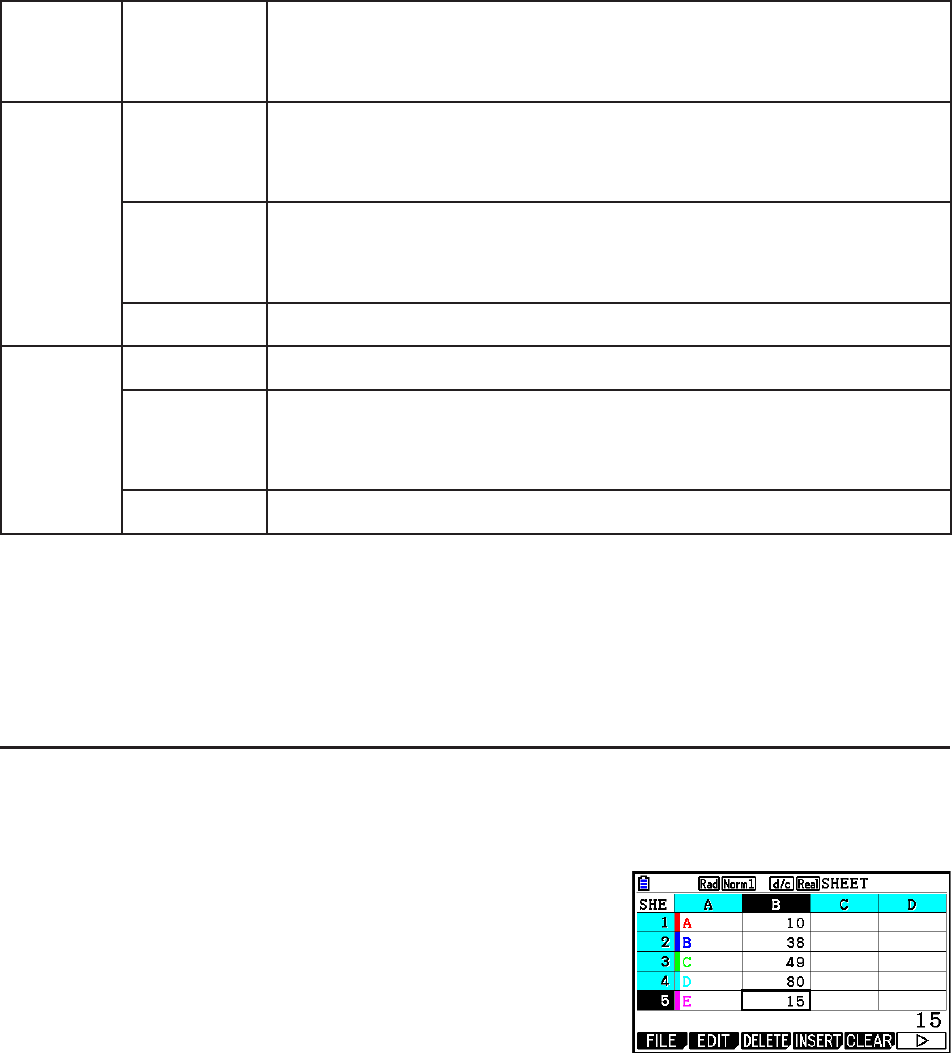
Example: To input the data below into a spreadsheet and then draw a pie chart
with “Category” selected as the Color Link setting
1. Input the data shown nearby, with the text color of cells from A1 through A5 as shown.
• For information about specifying the text color, see “Specifying Cell Formatting” (page
9-13).
2. Select the cells in the range A1:B5.
• For information about selecting cells, see “To select a range of cells” (page 9-7).