


CASIO
6-3
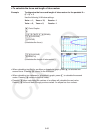
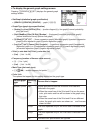
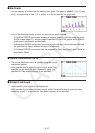
u To display the general graph settings screen
Pressing 1(GRAPH) 6(SET) displays the general graph
settings screen.
• StatGraph (statistical graph specification)
• { GRAPH1 } / { GRAPH2 } / { GRAPH3 } ... graph {1}/{2}/{3}
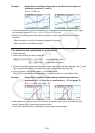
• Graph Type (graph type specification)
• { Scatter } / {
xy Line} / { NPPlot } / { Pie } ... {scatter diagram}/{ xy line graph}/{normal probability
plot}/{pie chart}
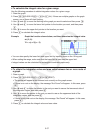
• { Hist } / { MedBox } / { Bar } / { N-Dist } / { Broken } ... {histogram}/{med-box graph}/{bar graph}/
{normal distribution curve}/{broken line graph}
• { X } / { Med } / { X
2
} / { X
3
} / { X
4
} ... {linear regression graph}/{Med-Med graph}/{quadratic regression
graph}/{cubic regression graph}/{quartic regression graph}
• { Log } / { ae
bx
}/{ab
x
} / { Power } / { Sin } / { Logistic } ... {logarithmic regression graph}/{exponential
regression graph (ae
bx
)}/{exponential regression graph (ab
x
)}/{power regression graph}/
{sinusoidal regression graph}/{logistic regression graph}
• XList ( x -axis data list)/YList ( y -axis data list)
• { List } ... {List 1 to 26}
• Frequency (number of times a value occurs)
• { 1 } ... {1-to-1 plot}
• { List } ... {List 1 to 26}
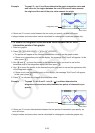
• Mark Type (plot mark type)
• { ٗ } / {
} / { } ... scatter diagram plot points
• Color Link
The options that appear for this setting depend on the graph type.
For this graph
type:
Selecting
this:
Causes this to happen:
Scatter,
xyLine
X&Y Colors specified for both the XList and YList data are
reflected in the graph.
• When the same lines of the XList and YList are the same
color, plot marks and line will be drawn in the graph using
that color.
• When the same lines of the XList and YList are different
colors, the graph plot marks are shown as and lines are
drawn in black.
OnlyX The color specified only for the XList data is reflected in the
graph.
OnlyY The color specified only for the YList data is reflected in the
graph.
Off List data color specifications are ignored.