


CASIO
5-59
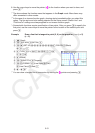
k Conic Section Graph Analysis
You can determine approximations of the following analytical results using conic section
graphs.
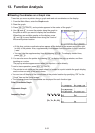
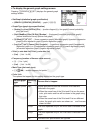
1. From the Main Menu, enter the Conic Graphs mode.
2. Select the function type.
1(RECT).... {rectangular coordinate}
2(POL).... {polar coordinate}
3(PARAM).... {parametric}
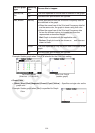
3. Use f and c to select the conic section you want to analyze.
4. Input the conic section constants.
5. Draw the graph.
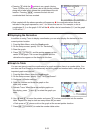
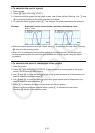
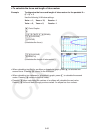
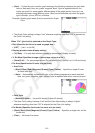
After graphing a conic section, press !5(G-SOLVE) to display the following graph
analysis menus.
u Parabolic Graph Analysis
• { FOCUS } / { VERTEX } / { LENGTH } / { e } ... {focus}/{vertex}/{length of latus rectum}/{eccentricity}
• { DIRECTX } / { SYMMETRY } ... {directrix}/{axis of symmetry}
• { X-ICEPT } / { Y-ICEPT } ... {
x -intercept}/{ y -intercept}
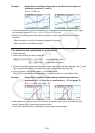
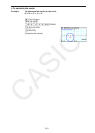
u Circular Graph Analysis
• { CENTER } / { RADIUS } ... {center}/{radius}
• { X-ICEPT } / { Y-ICEPT } ... {
x -intercept}/{ y -intercept}
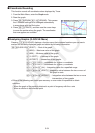
u Elliptical Graph Analysis
• { FOCUS } / { VERTEX } / { CENTER } / { e } ... {focus}/{vertex}/{center}/{eccentricity}
• { X-ICEPT } / { Y-ICEPT } ... {
x -intercept}/{ y -intercept}
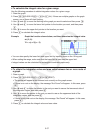
u Hyperbolic Graph Analysis
• { FOCUS } / { VERTEX } / { CENTER } / { e } ... {focus}/{vertex}/{center}/{eccentricity}
• { ASYMPT } ... {asymptote}
• { X-ICEPT } / { Y-ICEPT } ... {
x -intercept}/{ y -intercept}