


11–8 Statistical Operations
File name 32sii-Manual-E-0424
Printed Date : 2003/4/24 Size : 17.7 x 25.2 cm
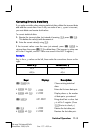
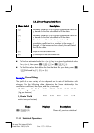
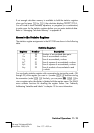
L.R. (Linear Regression) Menu
Menu Label Description
{
º
ˆ
} Estimates (predicts) x for a given hypothetical value of
y, based on the line calculated to fit the data.
{
¸
ˆ
} Estimates (predicts) y for a given hypothetical value of
x, based on the line calculated to fit the data.
{
T
} Correlation coefficient for the (x, y) data. The
correlation coefficient is a. number in the range –1
through +1 that measures how closely the calculated
line fits the data.
{
P
} Slope of the calculated line.
{
E
} y–intercept of the calculated line.
To find an estimated value for x (or y), key in a given hypothetical value
for y (or x), then press
{
,
{
º
ˆ
} (or
{
,
{
¸
ˆ
}).
To find the values that define the line that best fits your data, press
{
,
followed by {
T
}, {
P
}, or {
E
}.
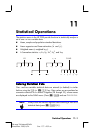
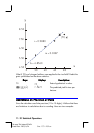
Example:
Curve Fitting.
The yield of a new variety of rice depends on its rate of fertilization with
nitrogen. For the following data, determine the linear relationship: the
correlation coefficient, the slope, and the y–intercept.
X, Nitrogen Applied
(kg per hectare)
0.00 20.00 40.00 60.00 80.00
Y, Grain Yield
(metric tons per hectare)
4.63 5.78 6.61 7.21 7.78
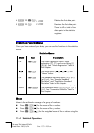
Keys: Display: Description:
z
b
{
´
}
Clears all, previous statistical