


16–10 Statistics Programs
File name 32sii-Manual-E-0424
Printed Date : 2003/4/24 Size : 17.7 x 25.2 cm
f
%@)
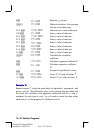
Retrieves
%@
prompt.
W
U
%@)
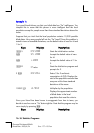
Deletes the last pair. Now proceed
with the correct data entry.
37.9
f
&@)
Enters correct x–value of data pair.
100
f
%@)
Enters y–value of data pair.
36.2
f
&@)
Enters x–value of data pair.
97.5
f
%@)
Enters y–value of data pair.
35.1
f
&@)
Enters x–value of data pair.
95.5
f
%@)
Enters y–value of data pair.
34.6
f
&@)
Enters x–valise of data pair.
94
f
%@)
Enters y–value of data pair.
W
R
/)
Calculates the correlation
coefficient.
f
/)
Calculates regression coefficient B.
f
/)
Calculates regression coefficient
M.
f
%@)
Prompts for hypothetical x–value.
37
f
&@)
Stores 37 in X and calculates
y
ˆ
.
101
f
%@)
Stores 101 in Y and calculates
x
ˆ
.
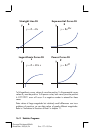
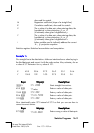
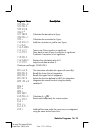
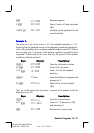
Example 2:
Repeat example 1 (using the same data) for logarithmic, exponential, and
power curve fits. The table below gives you the starting execution label and
the results (the correlation and regression coefficients and the x– and y–
estimates) for each type of curve. You will need to reenter the data values
each time you run the program for a different curve fit.