


More about Integration D–9
File name 32sii-Manual-E-0424
Printed Date : 2003/4/24 Size : 17.7 x 25.2 cm
Z
).
Uncertainty of approximation.
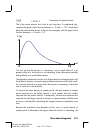
This is the correct answer, but it took a very long time. To understand why,
compare the graph of the function between x = 0 and x = 10
3
, which looks
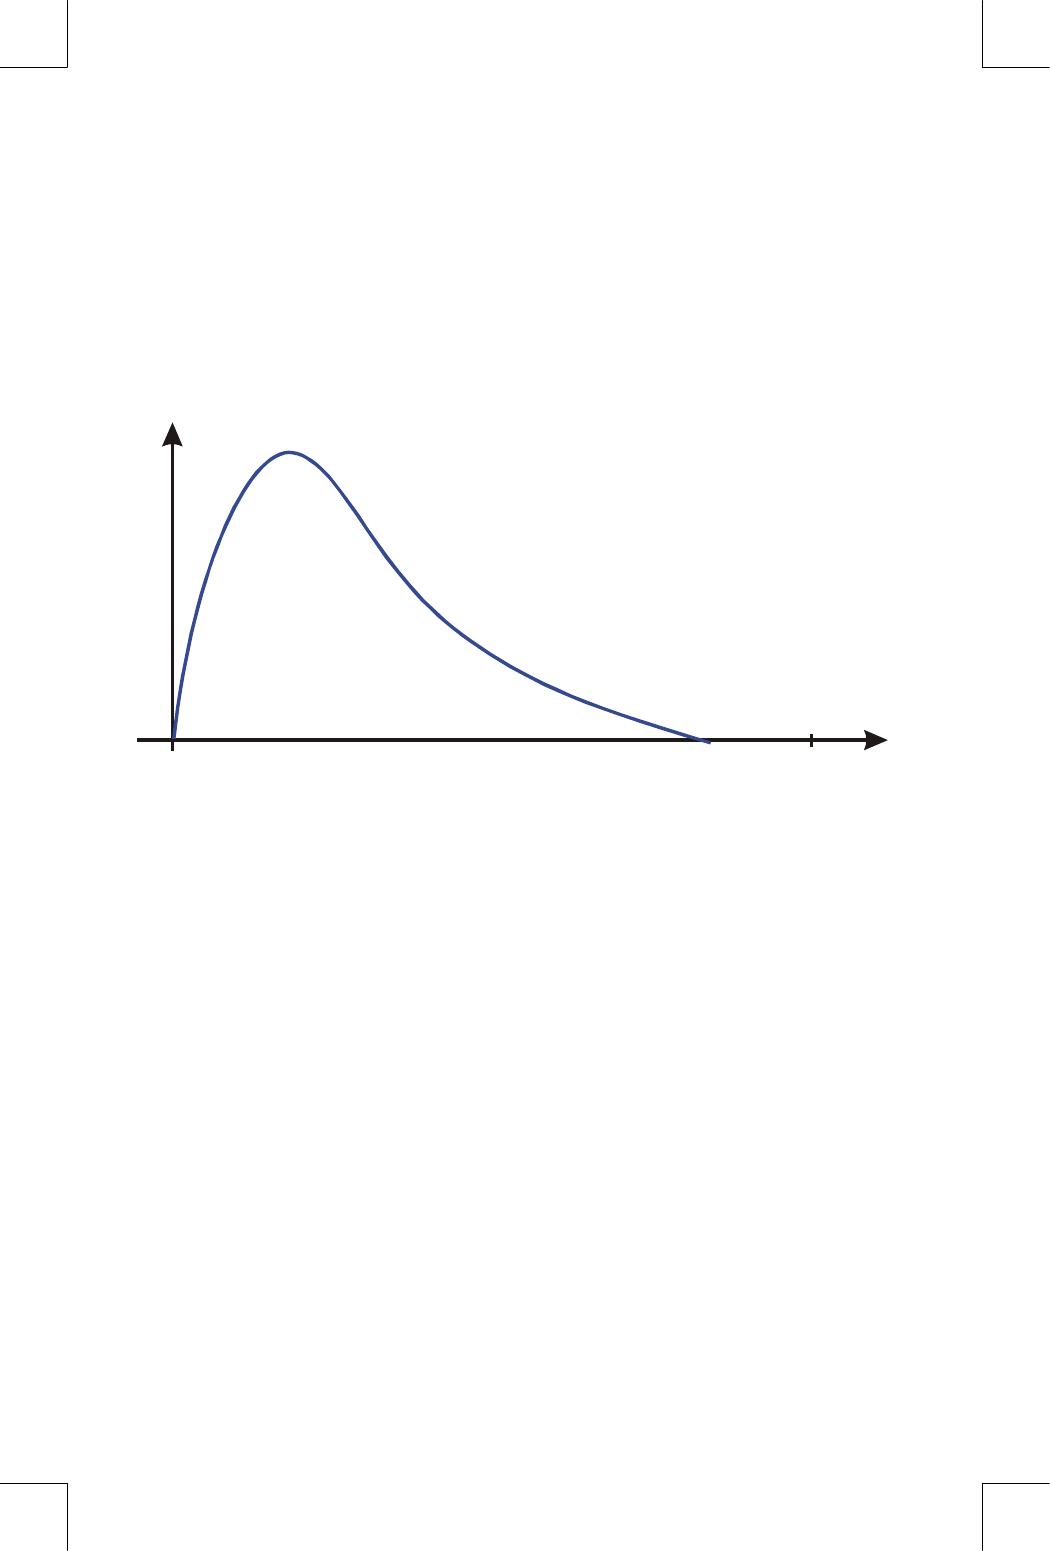
about the same as that shown in the previous example, with the graph of the
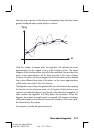
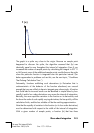
function between x = 0 and x = 10:
x
f (x)
0 10
You can see that this function is "interesting" only at small values of x. At
greater values of x, the function is not interesting, since it decreases smoothly
and gradually in a predictable manner.
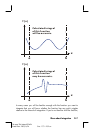
The algorithm samples the function with higher densities of sample points until
the disparity between successive approximations becomes sufficiently small.
For a narrow interval in an area where the function is interesting, it takes less
time to reach this critical density.
To achieve the same density of sample points, the total number of sample
points required over the larger interval is much greater than the number
required over the smaller interval. Consequently, several more iterations are
required over the larger interval to achieve an approximation with the same
accuracy, and therefore calculating the integral requires considerably more
time.
Because the calculation time depends on how soon a. certain density of
sample points is achieved in the region where the function is interesting, the