


More about Integration D–3
File name 32sii-Manual-E-0424
Printed Date : 2003/4/24 Size : 17.7 x 25.2 cm
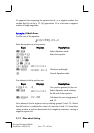
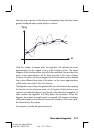
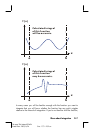
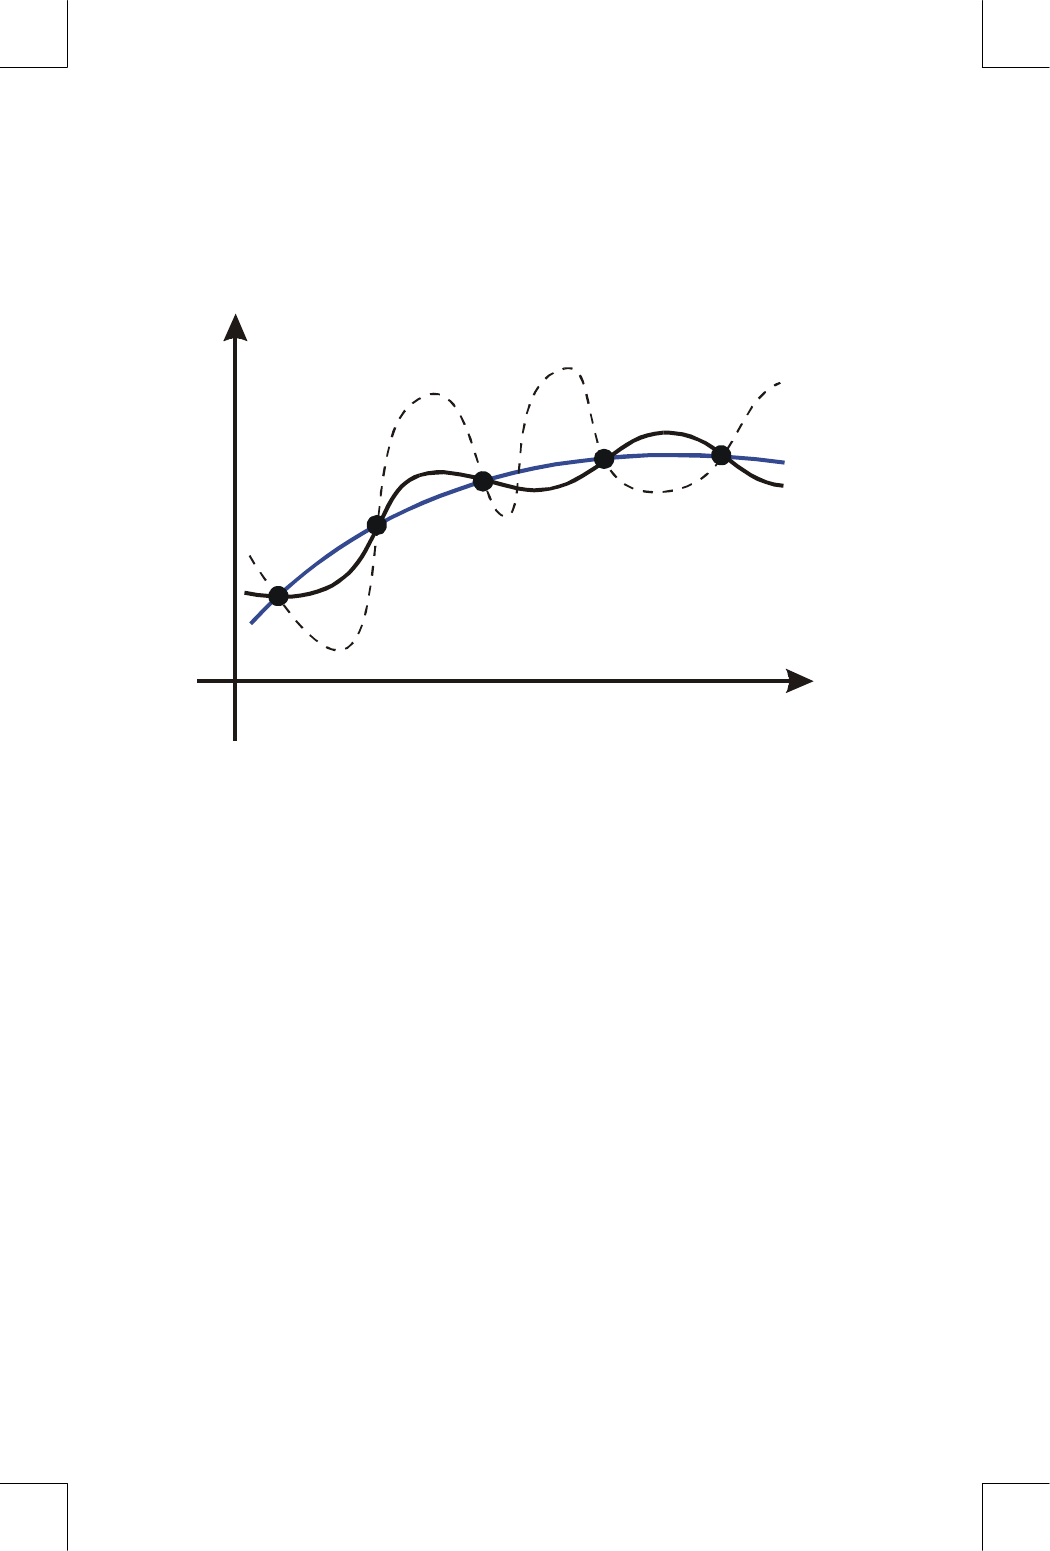
showing (over a portion of the interval of integration) three functions whose
graphs include the many sample points in common.
f (x)
x
With this number of sample pints, the algorithm will calculate the same
approximation for the integral of any of the functions shown. The actual
integrals of the functions shown with solid blue and black lines are about the
same, so the approximation will be fairly accurate if f(x) is one of these
functions. However, the actual integral of the function shown with a dashed
line is quite different from those of the others, so the current approximation
will be rather inaccurate if f(x) is this function.
The algorithm cores to know the general behavior of the function by sampling
the function at more and more points. If a fluctuation of the function in one
region is not unlike the behavior over the rest of the interval of integration, at
some iteration the algorithm will likely detect the fluctuation. When this
happens, the number of sample points is increased until successive iterations
yield approximations that take into account the presence of the most rapid,
but characteristic, fluctuations.
For example, consider the approximation of