


100 Intel NetStructure Cache Appliance Administrator’s Guide
Viewing Protocol statistics
Protocol statistics report the appliance system’s use of the HTTP, NNTP, FTP,
and ICP protocols.
▼ Viewing protocol statistics
1 Select the monitor menu, and press Enter.
2 Select protocols, and press Enter. Doing so causes a list of protocols to
appear on screen.
3 Select the protocol you want to view and press Enter.
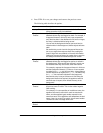
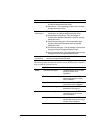
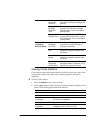
The following table describes the statistics for the HTTP-trans protocol.
Open Client
Connections
The number of currently open
client connections.
Cache Transfers in
Progress
The number of cache transfers
(cache reads and writes) in
progress.
Network Client Throughput
(Mbit/sec)
The number of bytes per second
through node (and cluster).
Transactions Per
Second
The number of HTTP transactions
per second.
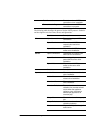
Statistic (Continued) Description (Continued)
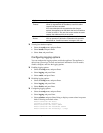
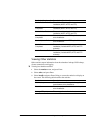
Statistics Description
Hits
❚ Fresh—The percentage of hits that are fresh and their
average transaction times.
❚ Stale Revalidated—The percentage of hits that are
stale and revalidated, turn out to be still fresh and
served, and their average transaction times.
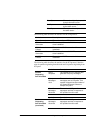
Misses
❚ Now Cached—The percentage of requests for
documents that were not in the cache (but are now) and
their average transaction times.
❚ Server No Cache—The percentage of requests for
documents that were not in the cache, but have server
no-cache headers (cannot be cached); and their
average transaction times.
❚ Stale Reloaded—The percentage of misses that are
revalidated, turn out to be changed, reloaded, and
served; and their average transaction times.
❚ Client No Cache—The percentage of misses with client
no-cache headers and their average transaction times.