


Chapter 3 Monitoring Appliance Performance 19
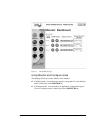
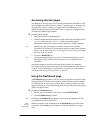
Use the Dashboard page to:
✔ Select a node
✔ See which nodes are on and which are off
✔ See if an alarm condition exists on any node
If an alarm condition exists, you can click the alarm light to view a
description of the alarm and resolve it.
✔ See the number (cumulative to date) of objects served to users from each
node
✔ See the traffic load (as current transactions per second)
The meter dial shows you how hard a node is working. When the needle is to
the left on the dial, the work load is light. When the needle is to the far right
(red), the node is overloaded.
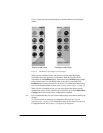
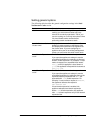
Dashboard alert lights
The Dashboard contains two alert lights: an on/off light and an alarm light. Alert
lights indicate the following about a node:
Resolving alarms
Alarms alert you to problems or warn you of potential problems. Alarm
conditions themselves are built into the appliance—you cannot change them.
If an alarm light is on, you can click it to view a description of the alarm
conditions. Click the Resolve button to acknowledge that you have been
informed of the condition.
Important Clicking the Resolve button only dismisses alarm messages; it does not actually
resolve the cause of the alarms.
Exposing node detail
Click the More Detail link to expose the following information for the listed
nodes in the cluster:
✔ Cache hit rate
✔ Cache hit rate, fresh
Alert light Condition Description
on/off light Green Caching is active.
on/off light Dark Caching is not active.
alarm light Green No alarms.
alarm light Red with link to alarms Alarms exist for that node. Click the
red alarm light for more information.
alarm light Yellow A cluster problem exists.