


4. Monitoring the Unit
4-6
February 2001 8784-A2-GB20-30
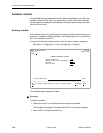
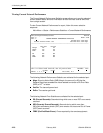
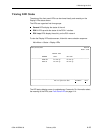
Performance Statistics
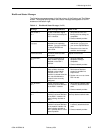
Performance statistics can assist you in determining the duration of specific
conditions and provide a historical context for problem detection and analysis.
Statistics are maintained for up to 96 15-minute intervals (24 hours).
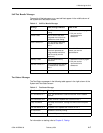
Select a port to view performance statistics for that port. Port 1 is the default.
Use the applicable virtual function keys to page through the intervals and clear
statistics.
Select PgUp or PgDn to view more statistics.
Select ClrNear or ClrFar to clear the near- and far-end statistics to zero.
Select ClrStats to clear all statistics to zero.
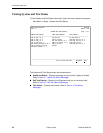
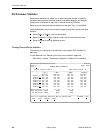
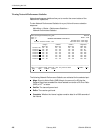
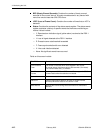
Viewing Network Error Statistics
The terminal unit maintains error statistics on the network DSL interface for
each port.
To view Network Error Statistics, follow this menu selection sequence:
Main Menu
→
Status
→
Performance Statistics
→
Network Error Statistics
main/status/performance/net_error Hotwire
Slot: 4: Model: 8784
Port: 2 NETWORK ERROR STATISTICS
Current Interval Timer: 2 Error Events Counter: 34
--------------------------------------------------------------------------------
---ES--- ---SES--- --FEBE-- -Complete-
Near Far Near Far Near Far Near Far
Current Int: 000 000 000 000 000 000 Yes No
Interval 01 000 000 000 000 000 000 Yes Yes
Interval 02 000 000 000 000 000 000 Yes Yes
Interval 03 000 000 000 000 000 000 Yes Yes
Interval 04 000 000 000 000 000 000 Yes Yes
Interval 05 000 000 000 000 000 000 Yes Yes
Interval 06 000 000 000 000 000 000 Yes Yes
Interval 07
000 000 000 000 000 000 Yes Yes
Worst Interval: 24 09 14 08 18 18
Near Tot(valid): 00010 00000 00000
Far Tot(valid): 00010 00000 00000
--------------------------------------------------------------------------------
Ctrl-a to access these functions, ESC for previous menu MainMenu Exit
PgUp PgDn ClrNear ClrFar