


4. Monitoring the Unit
8784-A2-GB20-30 February 2001
4-11
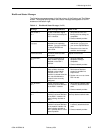
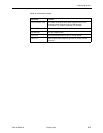
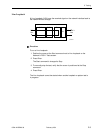
Fields on this screen include:
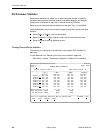
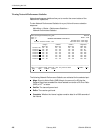
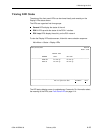
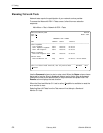
Viewing DSX-1 Performance Statistics
DSX-1 performance statistics allow you to monitor the current status of the DSX-1
interface when ESF framing is selected.
To view DSX-1 Performance Statistics, follow this menu selection sequence:
Main Menu
→
Status
→
Performance Statistics
→
DSX-1 Statistics
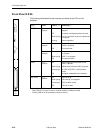
The following DSX-1 Performance Statistics are collected:
ES (Errored Seconds):
Seconds during which one or more error events
occurred.
UAS (Unavailable Seconds):
Seconds during which service is unavailable.
UAS is received at the start of 10 consecutive SES and cleared at the start of
10 seconds with no SES.
SES (Severely Errored Seconds):
Seconds during which 320 or more cyclic
redundancy check (CRC) error events or at least one Out of Frame (OOF)
event occurred.
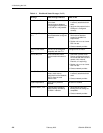
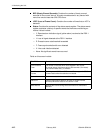
Field . . . Contains . . .
Current Interval
Timer
The number of seconds which have elapsed in the current
15-minute interval. Maximum value is 900 seconds (15 minutes).
This counter is reset every 15 minutes.
When zero, the port is disabled.
Payload Rate The rate of data transfer.
DSL Line Rate The rate of the DSL line.
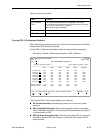
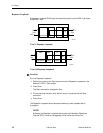
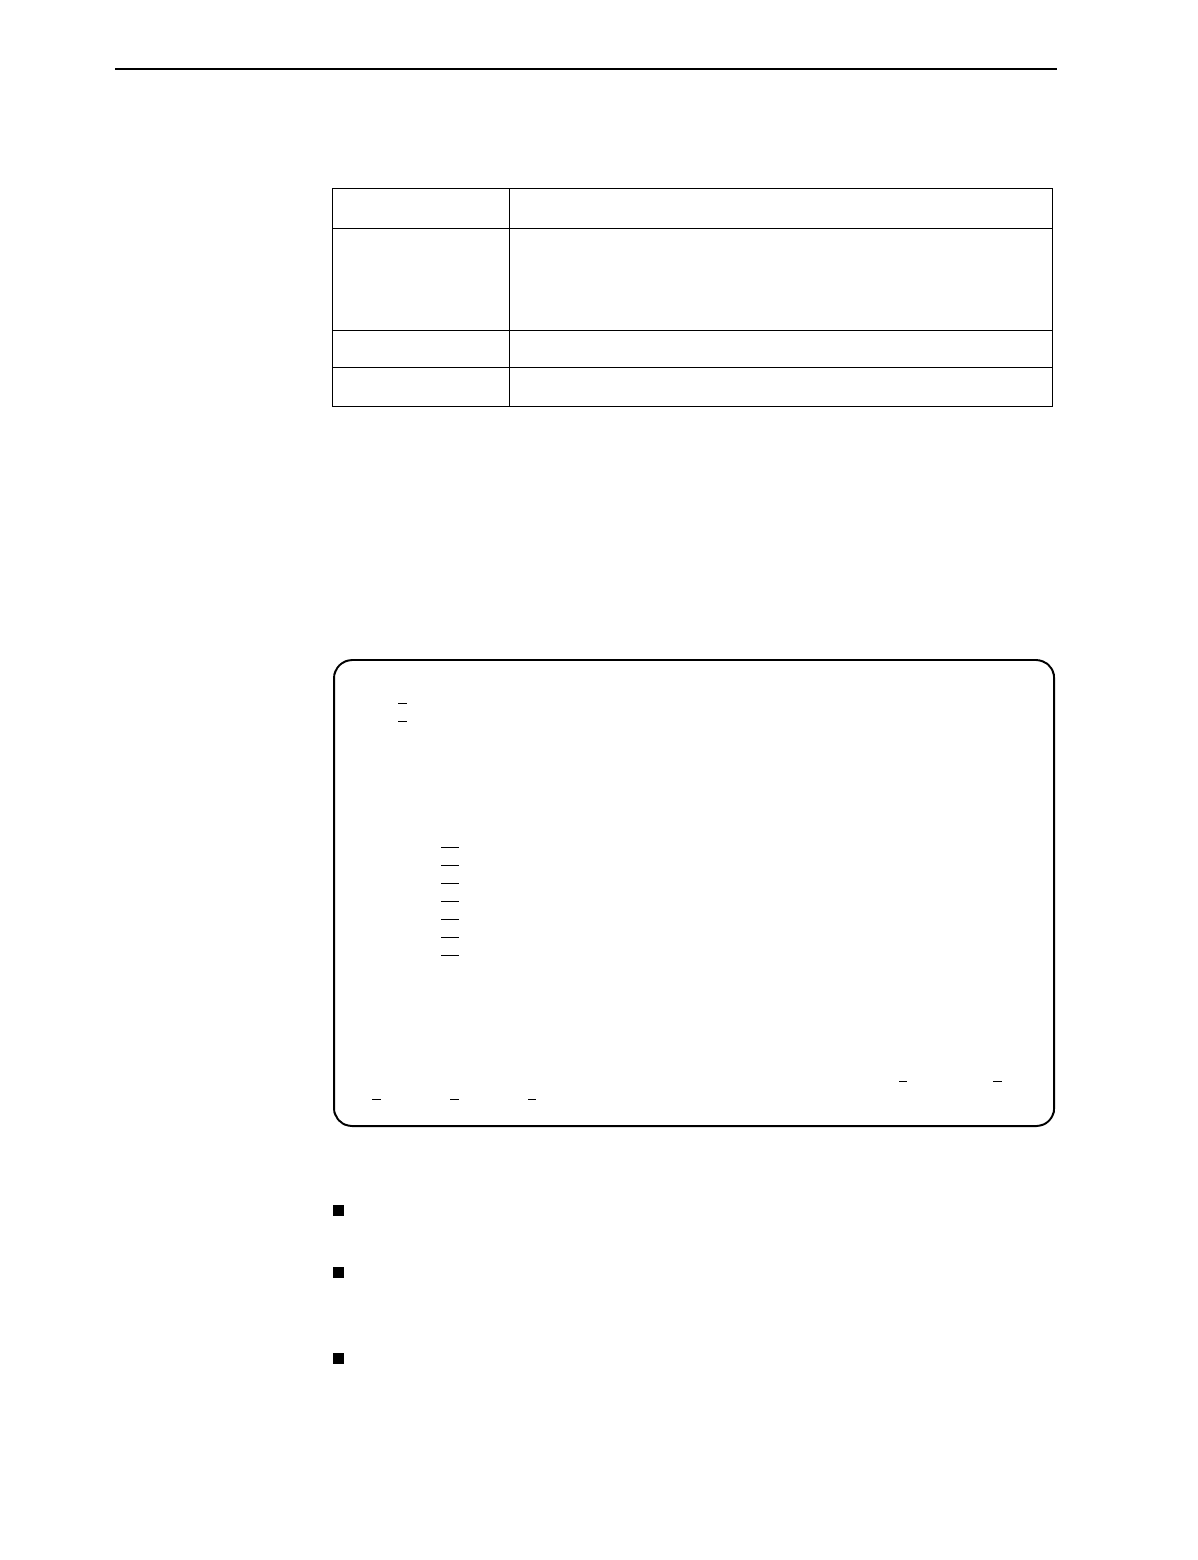
main/status/performance/DSX-1 Hotwire
Slot: 4 Model: 8784
Port: 2 DSX-1 PERFORMANCE STATISTICS
Current Interval Timer: 2 Error Events Counter: 0000
--------------------------------------------------------------------------------
--ES-- --UAS-- --SES-- --BES-- --LOFC-- --STATUS--
Current Int: 000 000 000 000 000 Y
Interval 01 000 000 000 000 000 none
Interval 02 000 000 000 000 000 none
Interval 03 000 000 000 000 000 none
Interval 04 000 000 000 000 000 none
Interval 05 000 000 000 000 000 none
Interval 06 000 000 000 000 000 none
Interval 07 000 000 000 000 000 none
Worst Interval: 24 14 14 09 18
Tot(valid 96): 00010 00000 00000 00000 002
--------------------------------------------------------------------------------
Ctrl-a to access these functions, ESC for previous menu MainMenu Exit
PgUp PgDn ClrStats