Operating Basics
14
764 Digital Audio Monitor User Manual
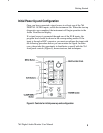
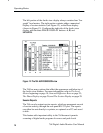
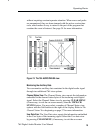
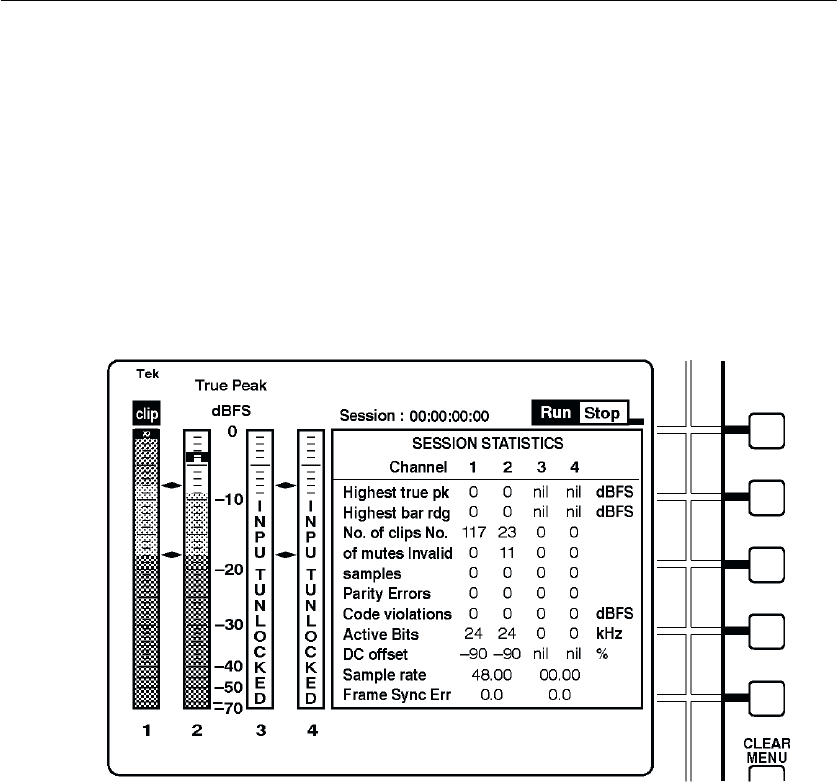
The left portion of the Audio view display always contains four “bar
graph” level meters. The right portion contains either a numerical
display of session statistics (see Figure 12), or the Phase display
(shown in Figure 13). Configure the right side of the Audio view
display with the three PHASE DISPLAY buttons: A, B, and
SESSION.
Figure 12: The 764 AUDIO/SESSION view
The 764 has many options that affect the appearance and behavior of
the Audio view features. For more information, refer to The Level
Meters beginning on page 18; Sum and Difference Bars on page 25;
The Phase Display on page 26; and The Session Display on page 29.
Session Reports
The 764 can also output session reports, which are permanent records
of session activity, through the rear-panel RS-232 port. The reports
can either be sent directly to a printer, or captured on a PC and saved
to disk.
This feature adds important utility to the 764 because it permits
screening of digital audio programs for errors and peak levels


