


Using Features for Advanced Applications
3–192
TDS 500C, TDS 600B, & TDS 700C User Manual
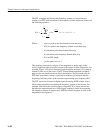
The FFT computes and displays the frequency content of a waveform you
acquire as an FFT math waveform. This frequency domain waveform is based on
the following equation:
X(k) +
1
N
N
2
* 1
S
n +
* N
2
x(n)e
*
j2pnk
N
for : k + 0toN*1
Where: x(n) is a point in the time domain record data array
X(k) is a point in the frequency domain record data array
n is the index to the time domain data array
k is the index to the frequency domain data array
N is the FFT length
j is the square root of −1
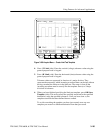
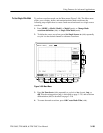
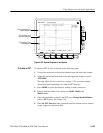
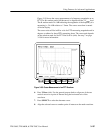
The resulting waveform is a display of the magnitude or phase angle of the
various frequencies the waveform contains with respect to those frequencies. For
example, Figure 3–92 shows the untransformed impulse response of a system in
channel 2 at the top of the screen. The FFT-transformed magnitude and phase
appear in the two math waveforms below the impulse. The horizontal scale for
FFT math waveforms is always expressed in frequency per division with the
beginning (left-most point) of the waveform representing zero frequency (DC).
The FFT waveform is based on digital signal processing (DSP) of data, which
allows more versatility in measuring the frequency content of waveforms. For
example, DSP allows the oscilloscope to compute FFTs of source waveforms
that must be acquired based on a single trigger, making it useful for measuring
the frequency content of single events. DSP also allows the phase as well as the
magnitude to be displayed.