


9-4 Statistics
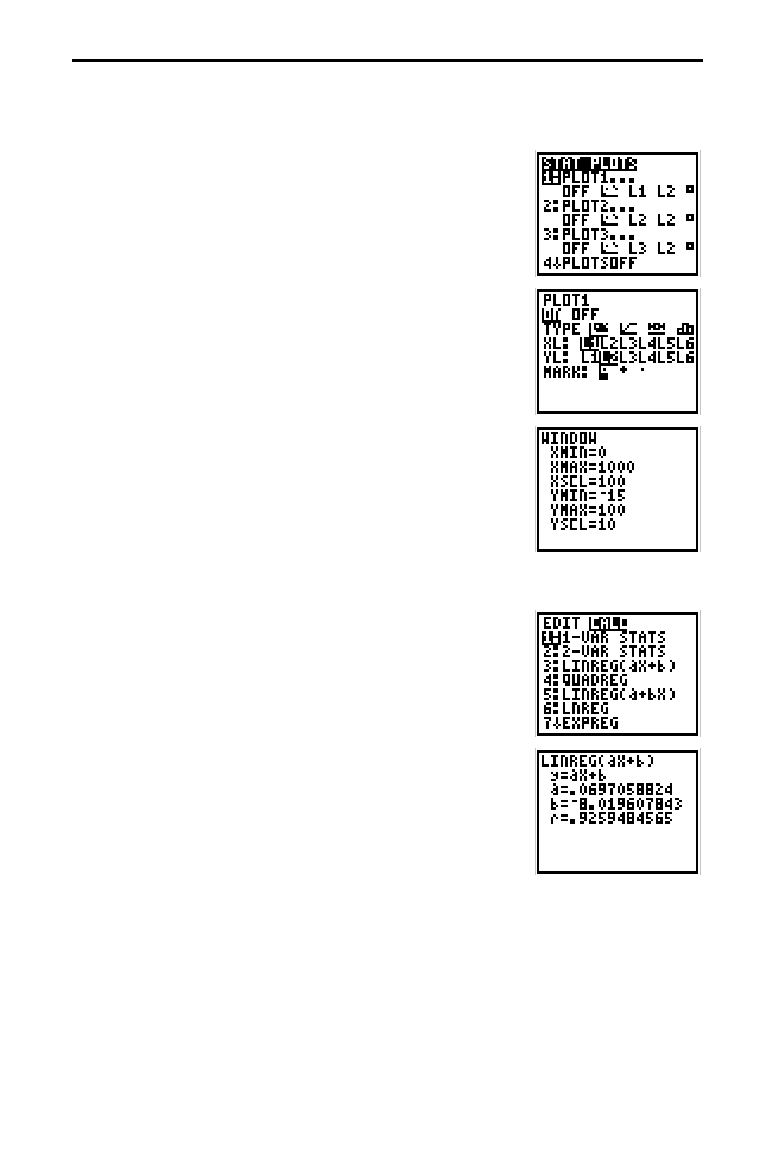
After entering and sorting the data, define the STAT PLOTS and Window
variables; then perform a linear regression (aX + b).
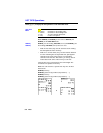
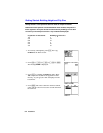
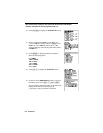
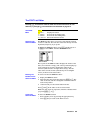
10. Press
y
¸
to display the
STAT PLOTS
screen.
11. Press
1
to display the
PLOT1
screen. Move the
cursor to
ON
, if necessary, and press
Í
to turn
PLOT1
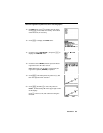
on. Leave
TYPE
as scatter plot (
¼
),
XL
(independent list)
as
L1
,
YL
(dependent list) as
L2
,
and
Mark
as ›.
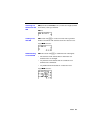
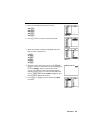
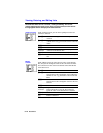
12. Press
)
to display the Window variables.
Enter the following values.
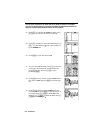
0
for
XMIN
1000
for
XMAX
100
for
XSCL
L
15
for
YMIN
100
for
YMAX
10
for
YSCL
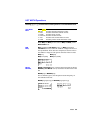
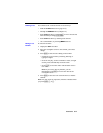
13. Press
A
9
to display the
STAT CALC
menu.
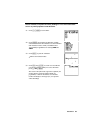
14. Press
3
to select
LINREG(aX+b)
, which is copied to
the Home screen. Press
2
¢
b
2
£
¸
.
The least-squares linear regression is calculated; the
display shows the values for
a
(slope),
b
(y-intercept), and
r
(correlation coefficient).