


Statistics 9-21
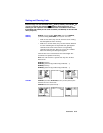
PLOTSOFF
and
PLOTSON
allow you to turn statistical plots
off or on from the Home screen or a program. Used without
plot#
, they turn all plots off or all plots on. Used with
plot#
,
they turn specific plots off or on.
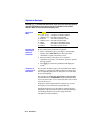
PLOTSOFF
or
PLOTSON
PLOTSOFF
plot#
,
plot#
,
. . .
PLOTSON
plot#
,
plot#
,
. . .
For example,
PLOTSOFF
followed by
PLOTSON 3
turns all
plots off and then turns
PLOT3
on.
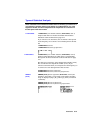
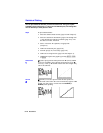
Statistical plots are displayed on the current graph. You may
define the viewing window by pressing
)
and then
entering values for the Window variables.
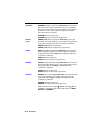
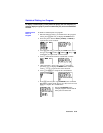
When you trace a scatter plot or XYLine, tracing begins at the
first element in the lists.
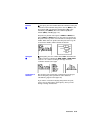
When you trace a box plot, tracing begins at
MED
(the
median). Press
6
to trace to
Q1
and
MINX
. Press
9
to trace
to
Q3
and
MAXX
.
When you trace a histogram, the cursor moves to the top
center of each column, starting at the first column.
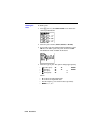
When you press
7
or
8
to move to another plot or
Y=
function, tracing moves to the current or beginning point on
that plot.
Turning Plots Off
or On
Defining the
Viewing Window
Tracing a Stat
Plot