


11-14 Applications
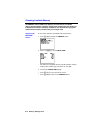
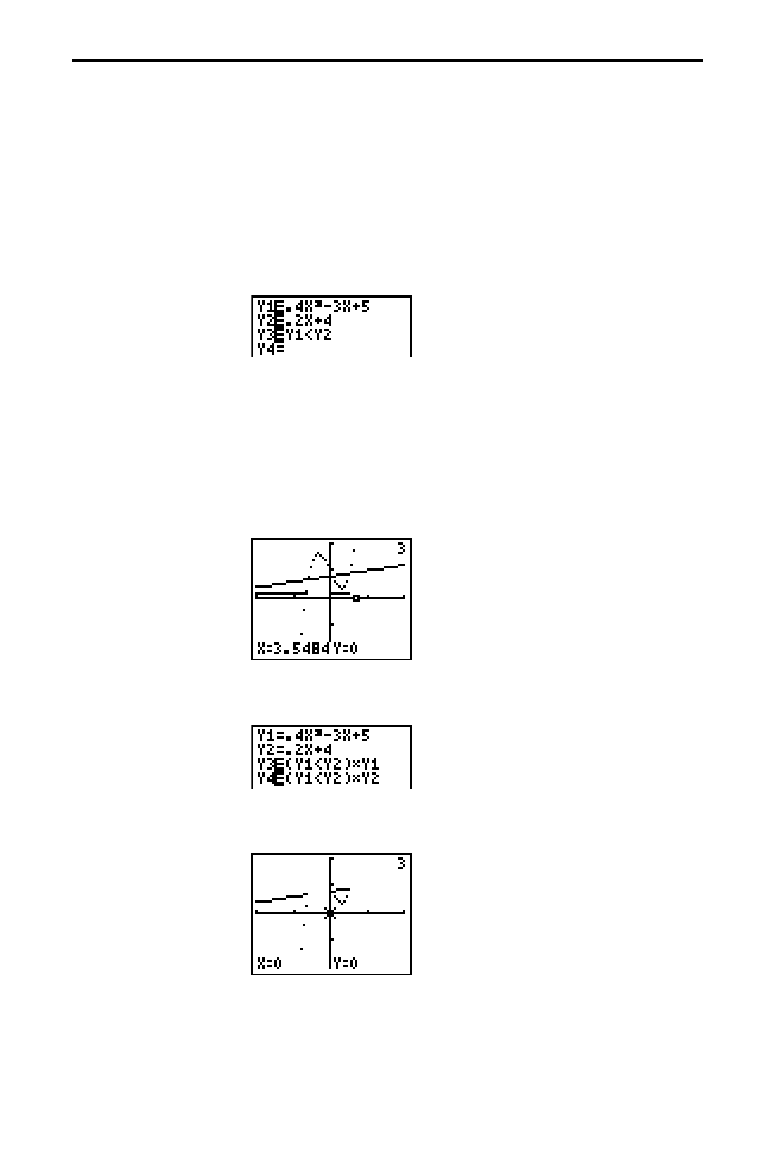
Examine the inequality
.
4X
òì
3X+5<
.
2X+4 graphically. Use the TEST functions to
explore the values of X where the inequality is true and where it is false.
1. Press
3
. Select
DOT
,
SIMUL
, and the default mode
settings. Press
2
"
, and turn off all stat plots.
2. Press
(
, and turn off all functions. Enter the left side of
the inequality as
Y1
, the right side as
Y2
, and the statement
of the inequality as
Y3
.
Y3
evaluates to 1 if true and 0 if
false.
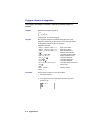
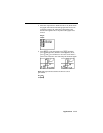
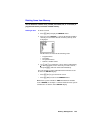
3. Press
)
, and enter these Window variable values.
Xmin=
ë
10 Ymin=
ë
10
Xmax=10 Ymax=10
Xscl=5 Yscl=5
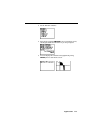
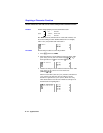
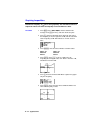
4. Press
+
. Press
8
8
to move to
Y3
. Trace the
inequality, observing the value of X.
Y3
is 1 when
Y1
<
Y2
,
and
Y3
is 0 when
Y1
≥
Y2
.
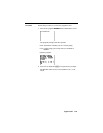
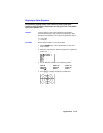
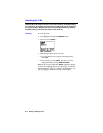
5. Press
(
and turn off
Y1
and
Y2
. Enter equations to graph
only the inequality.
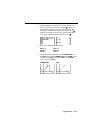
6. Press
+
. Notice that the values of
Y3
and
Y4
are zero
where the inequality is false.
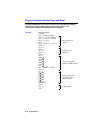
Graphing Inequalities
Procedure