


9-16 Statistics
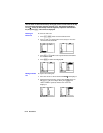
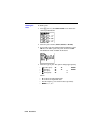
QUADREG
(quadratic regression,
STAT CALC
, item 4) fits the
data to the second-order polynomial y=ax
2
+bx+c. It displays
a
,
b
, and
c
. For three data points the equation is a polynomial
fit; for four or more, it is a polynomial regression. At least
three data points are required.
QUADREG
Xlistname
,
Ylistname
QUADREG
Xlistname
,
Ylistname
,
freqlistname
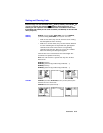
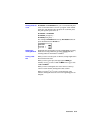
LINREG (a+bX)
(linear regression,
STAT CALC
, item 5) fits
the data to the model equation y=a+bx using a least-squares fit
and
x
and
y
. It displays
a
,
b
, and
r
(correlation coefficient).
LINREG (a+bX)
Xlistname
,
Ylistname
LINREG (a+bX)
Xlistname
,
Ylistname
,
freqlistname
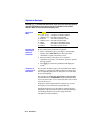
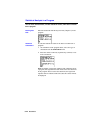
LNREG
(logarithmic regression,
STAT CALC
, item 6) fits the
data to the model equation y=a+b ln(x) using a least-squares
fit and transformed values
LN(x)
and
y
. It displays
a
,
b
, and
r
(correlation coefficient).
LNREG
Xlistname
,
Ylistname
LNREG
Xlistname
,
Ylistname
,
freqlistname
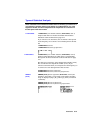
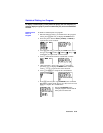
EXPREG
(exponential regression,
STAT CALC
, item 7) fits the
data to the model equation y=ab
x
using a least-squares fit and
transformed values
x
and
LN(y)
. It displays
a
,
b
, and
r
(correlation coefficient).
EXPREG
Xlistname
,
Ylistname
EXPREG
Xlistname
,
Ylistname
,
freqlistname
PWRREG
(power regression,
STAT CALC
, item 8) fits the data
to the model equation y=ax
b
using a least-squares fit and
transformed values
LN(x)
and
LN(y)
. It displays
a
,
b
, and
r
(correlation coefficient).
PWRREG
Xlistname
,
Ylistname
PWRREG
Xlistname
,
Ylistname
,
freqlistname
Note: Calculations for
v
,
G
X
,
G
X
ñ
,
SX
,
s
X
,
w
,
G
Y
,
G
Y
ñ
,
SY
,
s
Y
,
and
G
XY
are calculated using transformed values for
LNREG
,
EXPREG
, and
PWRREG
.
QUADREG
LINREG
(a+bX)
LNREG
EXPREG
PWRREG