


9-18 Statistics
You can plot statistical data that you have entered in lists. The types of plots
available include scatter plots, x-y lines, box and whisker plots, and histograms.
You can define up to three plots at a time.
To plot statistical data:
1. Enter the statistical data as lists (page 9
-
9 and Chapter 8).
2. Select the statistical calculations (pages 9
-
14 through 9-16
), and calculate the statistical variables (page 9
-
17) or fit
the data to a model, if desired.
3. Select or deselect
Y=
equations, as appropriate
(Chapter 4).
4. Define the statistical plot (page 9
-
20).
5. Turn the plot(s) on, if necessary (page 9
-
21).
6. Define the viewing window (page 9
-
21 and Chapter 4).
7. Display and explore the graph by pressing
,
,
*
,
or
+
.
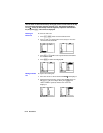
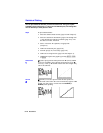
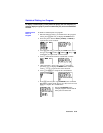
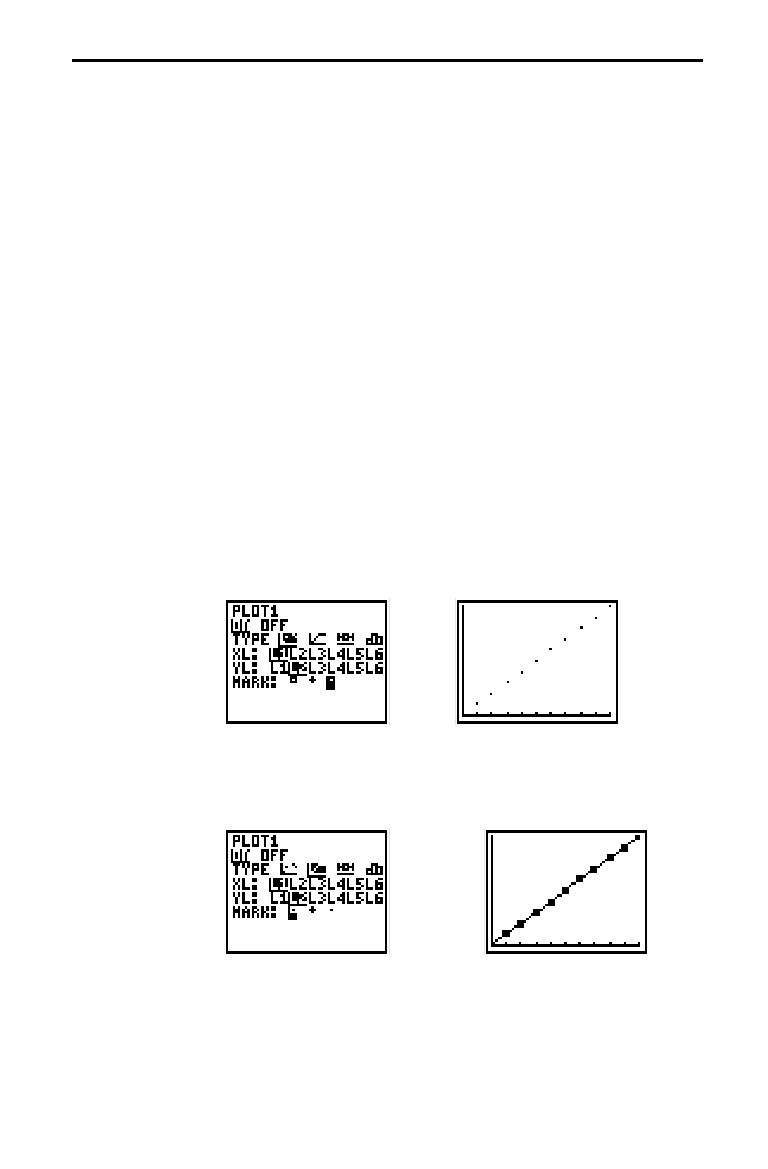
¼
(scatter plot) plots the data points from
XL
(X list) and
YL
(Y list) as coordinate pairs, showing each point as a box (
Â
),
cross (
+
), or dot (
¦
).
XL
and
YL
must be the same length. They
can be the same list.
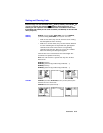
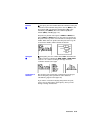
½
(XYLine) is a scatter plot in which the data points are
plotted and connected in the order in which they appear in
XL
and
YL
. You may want to sort the lists with
SORTA(
or
SORTD(
before plotting.
Statistical Plotting
Steps
Scatter Plot
¼
XYLine
½