


5-6 Parametric Graphing
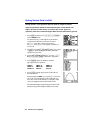
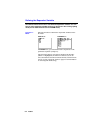
As in function graphing, three tools are available for exploring a graph: the free-
moving cursor, tracing, and zooming.
The free
-
moving cursor works the same in parametric
graphing as in function graphing (page 4-12).
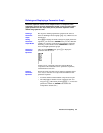
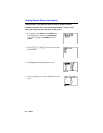
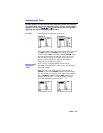
Pressing
+
puts the Trace cursor on the first selected
equation, at
TMIN
. You can then trace along the equation.
6
or
9
Moves the cursor one
TSTEP
at a time.
2
6
or
9
~
Moves the cursor five
TSTEP
s at a time.
7
or
8
Changes to the previous or next equation.
The equation number shows in the upper
right of the display.
M
Cancels tracing.
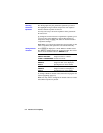
For each value of
T
, the calculator displays values for
X
and
Y
.
The values for
X
,
Y
, and
T
are updated as you move the Trace
cursor. If the cursor moves off the top or bottom of the
screen, the coordinate values continue to change
appropriately.
The Trace cursor remains in the same location if you leave
TRACE
and return, unless Smart Graph replots the graph.
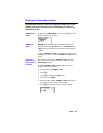
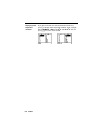
QuickZoom is available in parametric graphing, but panning is
not (page 4
-
13).
Pressing
*
works the same in parametric graphing as in
function graphing (page 4
-
15).
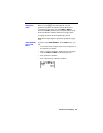
Parametric graphing uses the additional Window variables
TMIN
,
TMAX
, and
TSTEP
. These variables are not affected by
zooming unless you select
ZSTANDARD
, where
TMIN
= 0,
TMAX
= 6.283185307 (2
p
), and
TSTEP
= .1308996938996
(
p
/24).
Exploring a Parametric Graph
Free-Moving
Cursor
Tracing a
Parametric
Graph
Zooming in on a
Parametric
Graph