


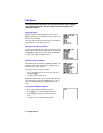
12 Getting Started
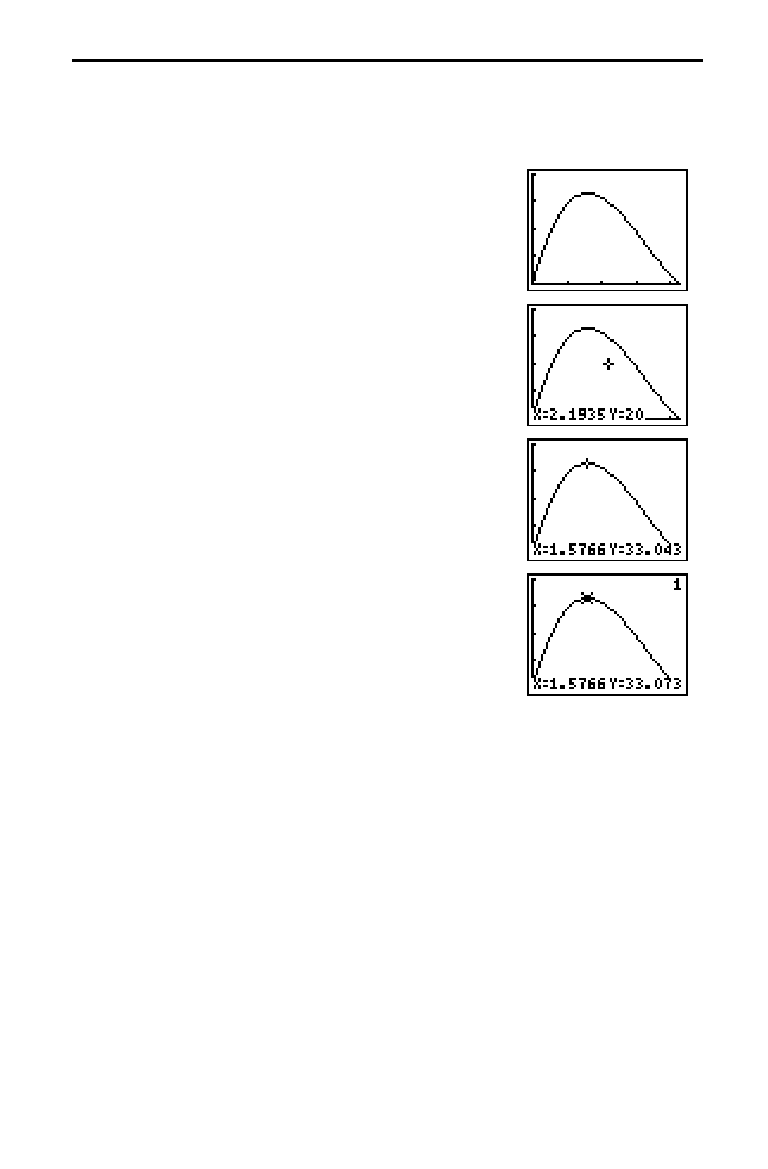
Now that you have defined the function to be graphed and the window in which
to graph it, you can display and explore the graph. You can trace along a
function with TRACE.
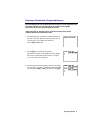
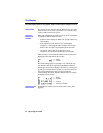
1. Press
s
to graph the selected function in the
viewing window.
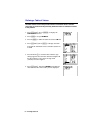
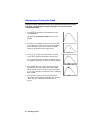
The graph of
Y1=(W–2X)(L
à
2–X)X
is shown in the
display.
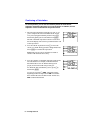
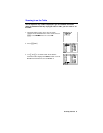
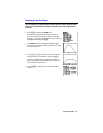
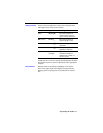
2. Press
~
once to display the free-moving cursor just
to the right of the center of the screen. The bottom
line of the display shows the X- and Y-coordinate
values for the position of the graph cursor.
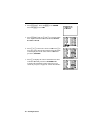
3. Use
|
,
~
,
}
, and
†
to position the free-moving
cursor at the apparent maximum of the function.
As you move the cursor, X- and Y-coordinate values
are updated continually to reflect the cursor position.
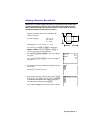
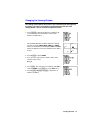
4. Press
r
. The Trace cursor appears on the
Y1
function.
1
in the upper right corner of the display
shows that the cursor is on
Y1
. As you press
|
and
~
, you trace along
Y1
, one
X
dot at a time, evaluating
Y1
at each
X
.
5. Press
|
and
~
until you are on the maximum Y
value. This is the maximum of
Y1(X)
for the X pixels.
(There may be a maximum value “in between”
pixels.)
Displaying and Tracing the Graph