


Function Graphing 4-17
ZDECIMAL
replots the functions immediately, updates the
Window variables to preset values that set
@
X
and
@
Y
equal to
.1
, and defines the
X
and
Y
value of each pixel as one decimal.
XMIN =
L
3.1 YMIN =
L
2.3
XMAX = 3.1 YMAX = 2.3
XSCL = 1 YSCL = 1
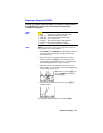
ZSQUARE
replots the functions immediately, redefining the
window based on the current Window variables, but adjusted
in only one direction so that
@
X=
@
Y
. This makes the graph of a
circle look like a circle.
XSCL
and
YSCL
remain unchanged.
The midpoint of the current graph (not the intersection of the
axes) becomes the midpoint of the new graph.
ZSTANDARD
replots the functions immediately, updating the
Window variables to the standard values:
XMIN =
L
10 YMIN =
L
10
XMAX = 10 YMAX = 10
XSCL = 1 YSCL = 1
ZTRIG
replots the functions immediately, updating the
Window variables to preset values appropriate for plotting trig
functions. In
RADIAN
mode, these are:
XMIN =
L
(31/12)
p
(
L
8.115781..) YMIN =
L
2 (
L
2)
XMAX = (31/12)
p
(8.1157810..) YMAX = 2 (2)
XSCL = (
p
/2) (1.5707963..) YSCL = 1 (1)
ZDECIMAL
ZSQUARE
ZSTANDARD
ZTRIG