


Statistics 9-19
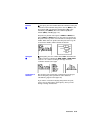
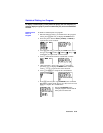
¾ (box plot) plots one-variable data. The whiskers on the plot
extend from the minimum data point in the set (
MINX
) to the
first quartile (
Q1
) and from the third quartile (
Q3
) to the
maximum point (
MAXX
). The box is defined by
Q1
, the
median (
MED
), and
Q3
(page 9
-
17).
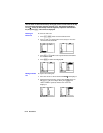
Box plots are plotted with respect to
XMIN
and
XMAX
, but
ignore
YMIN
and
YMAX
. When two box plots are plotted, the
first plots at the top of the screen and the second plots in the
middle. When three are plotted, the first plots at the top, the
second in the middle, and the third at the bottom.
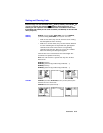
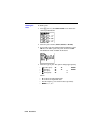
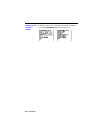
¿ (histogram) plots one-variable data.
XSCL
determines the
width of each bar, beginning at
XMIN
.
(XMAX
–
XMIN)
à
XSCL
must be
31. A value occurring on the edge of a bar is
counted in the bar to the right.
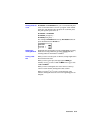
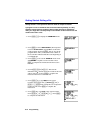
The frequency list specified for a statistical plot works just
like the frequency lists specified for other statistical
calculations (pages 9-14 through 9-16).
If you want to exclude an outlying data point from a plot,
enter a zero for that value in the frequency list to prevent
having to change the data lists.
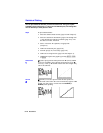
Box Plot
¾
Histogram
¿
Frequencies in
Stat Plots