


9-20 Statistics
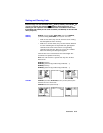
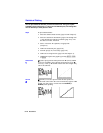
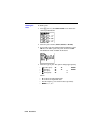
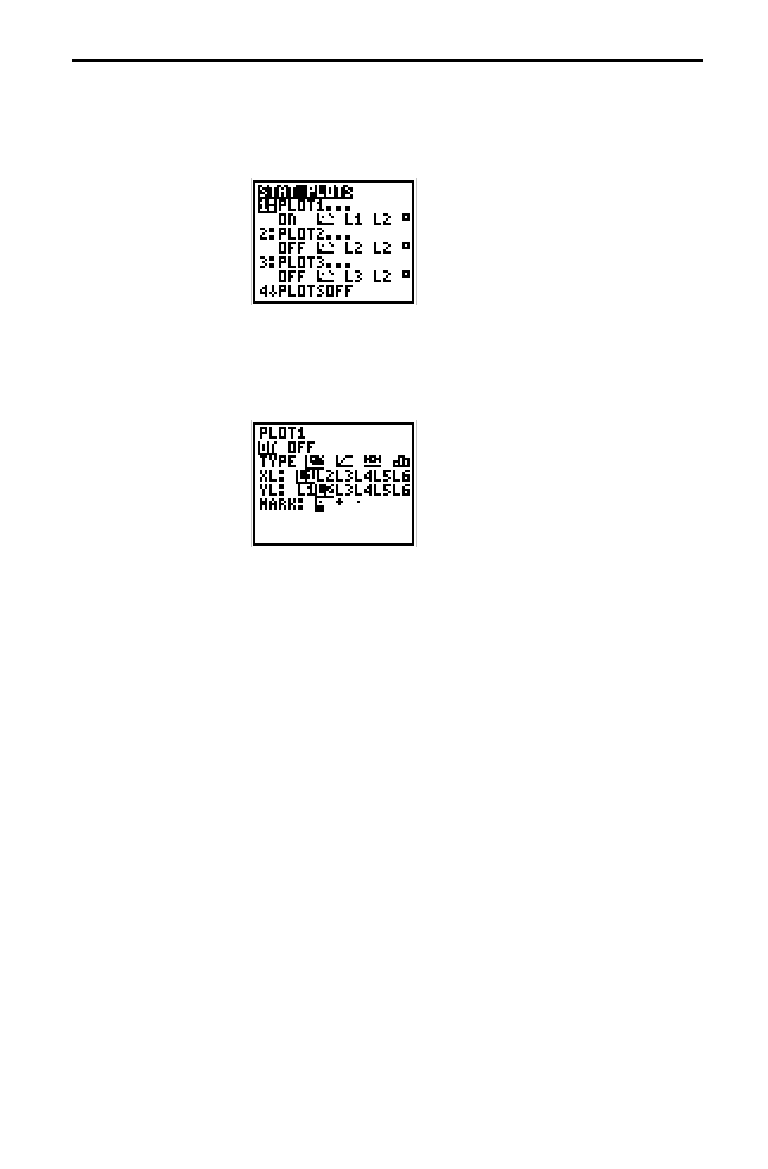
To define plots:
1. Press
2
"
. The
STAT PLOTS
screen shows the
current plot definitions.
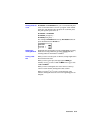
2. Select the plot to define (
PLOT1
,
PLOT2
, or
PLOT3
).
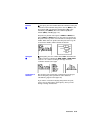
3. If you wish to plot the statistical data immediately, select
ON
. You can define a plot at any time and leave it
OFF
.
The definition will be available in the future.
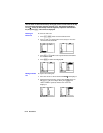
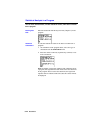
4. Select the type of plot. The options change appropriately.
¦
¼
(scatter plot):
XL YL MARK
¦
½
(XYLine):
XL YL MARK
¦
¾
(box plot):
XL F
¦
¿
(histogram):
XL F
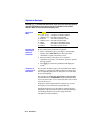
Where:
¦
XL
is the list of independent data.
¦
YL
is the list of dependent data.
¦
F
is the frequency (
1
is used if no list is specified).
¦
MARK
is
›
,
+
, or
¦
.
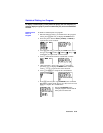
Defining the
Plots