


Web Browser Management
Page 5-6
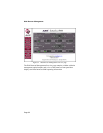
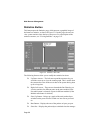
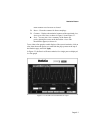
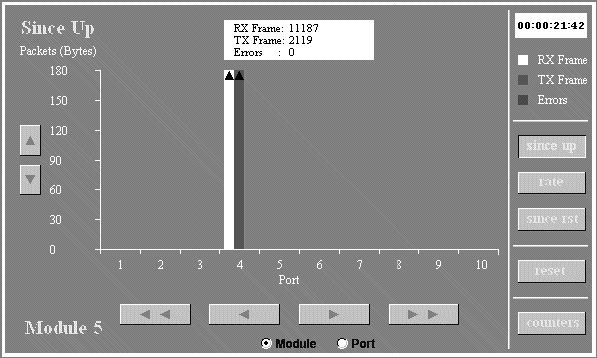
Statistics Button
This button opens the Statistics page, which presents a graphical image of
the IntraCore statistics, as shown in Figure 5-4. On this page, the user can
view system statistics since the last system reset. For a description of the
statistics counters, see “Viewing Statistics” on page 3-52.
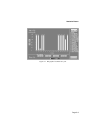
Figure 5-4 Statistics - Bar Chart
The following features allow you to modify the statistics bar chart.
G Up-Down Arrows – The left-most up and down arrows let you
scroll the screen up to view the counter graph. This is useful when
the counters have run off the screen due to the system having been
up for a long time.
G Right-Left Arrows - These arrows beneath the Bar Chart let you
view the statistics for different ports on the same module (if the
Port radio button is selected) or ports in different modules (if the
Module radio button is selected).
G Since Up Button – Brings up a graph of the total packets/bytes
switched on the ports since the switch was last reset or powered
on.
G Rate Button – Displays the rate of the packets or bytes per port.
G Since Rst – Displays the packets/bytes switched since the manage-