


DGS-3700-12/DGS-3700-12G Series Layer 2 Gigabit Ethernet Switch User Manual
230
Errors
The Web Manager allows port error statistics compiled by the Switch's management agent to be viewed as either a
line graph or a table. Four windows are offered.
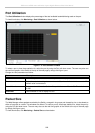
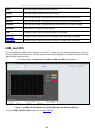
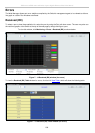
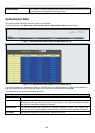
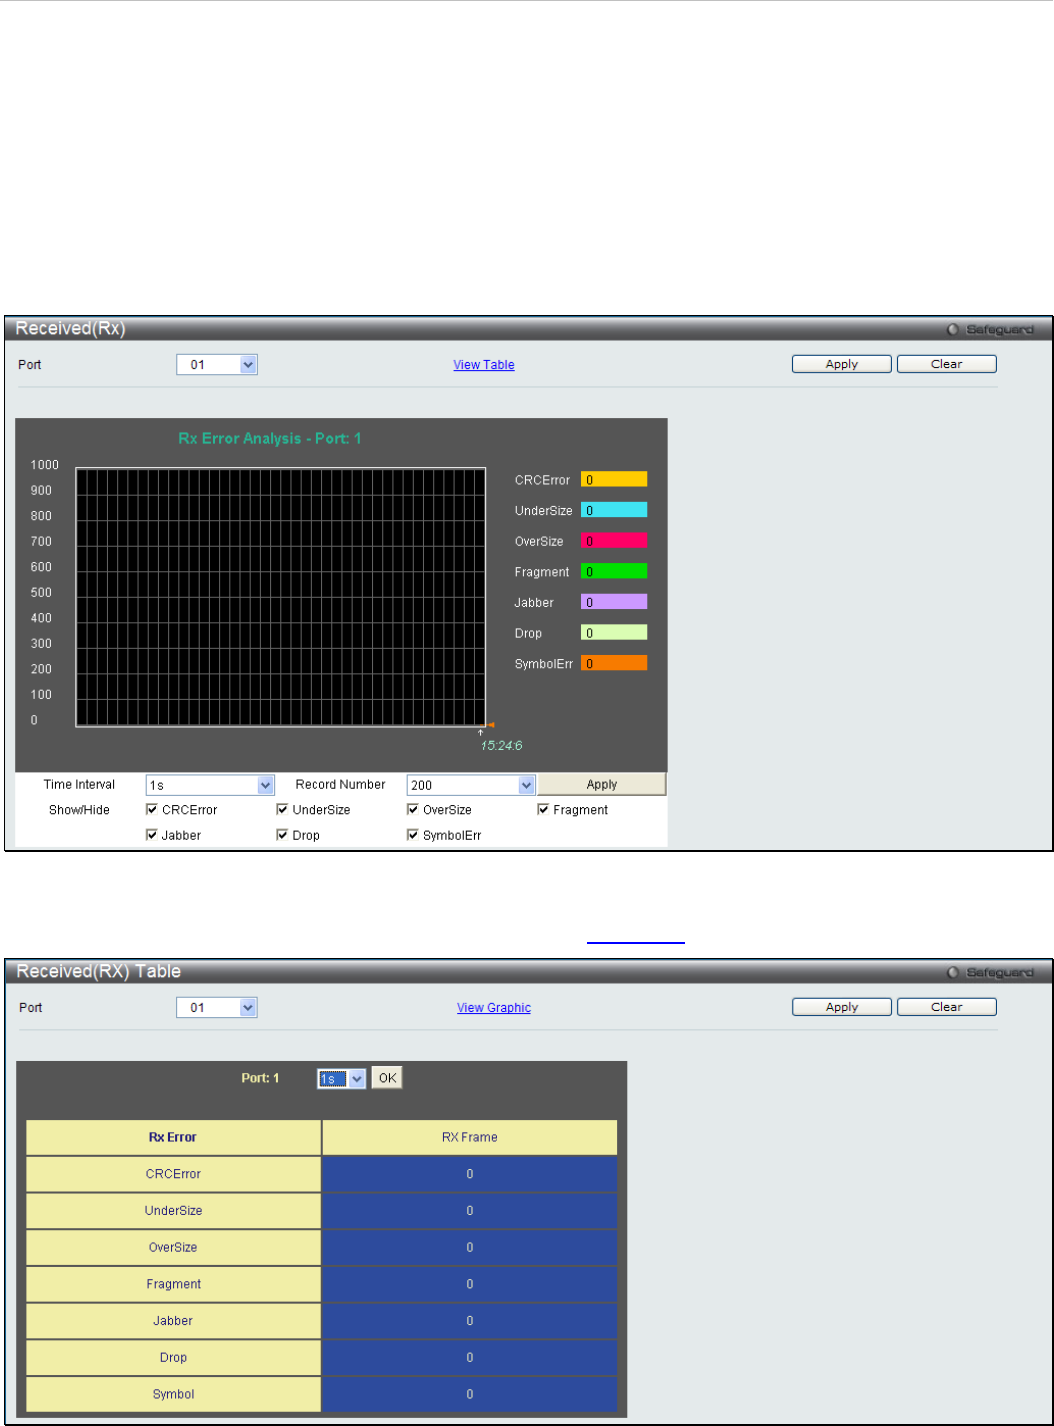
Received (RX)
To select a port to view these statistics for, select the port by using the Port pull-down menu. The user may also use
the real-time graphic of the Switch at the top of the web page by simply clicking on a port.
To view this window, click Monitoring > Errors > Received (RX) as shown below:
Figure 7 - 14 Received (RX) window (for errors)
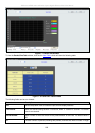
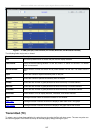
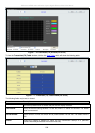
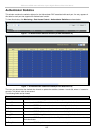
To view the Received (RX) Table window for errors, click the link
View Table, which will show the following table:
Figure 7 - 15 Received (RX) Table window (for errors)