


DGS-3700-12/DGS-3700-12G Series Layer 2 Gigabit Ethernet Switch User Manual
231
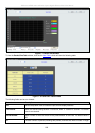
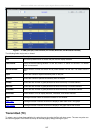
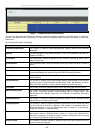
The following fields can be set:
Parameter Description
Port
Use the drop-down menu to choose the port that will display statistics.
Time Interval Select the desired setting between 1s and 60s, where "s" stands for seconds. The default
value is one second.
Record Number Select number of times the Switch will be polled between 20 and 200. The default value is
200.
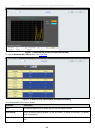
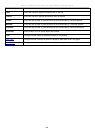
CRCError
Counts otherwise valid packets that did not end on a byte (octet) boundary.
UnderSize
The number of packets detected that are less than the minimum permitted packets size of 64
bytes and have a good CRC. Undersize packets usually indicate collision fragments, a nor-
mal network occurrence.
OverSize
Counts valid packets received that were longer than 1518 octets and less than the
MAX_PKT_LEN. Internally, MAX_PKT_LEN is equal to 1536.
Fragment
The number of packets less than 64 bytes with either bad framing or an invalid CRC. These
are normally the result of collisions.
Jabber
Counts invalid packets received that were longer than 1518 octets and less than the
MAX_PKT_LEN. Internally, MAX_PKT_LEN is equal to 1536.
Drop
The number of packets that are dropped by this port since the last Switch reboot.
Symbol
Counts the number of packets received that have errors received in the symbol on the
physical labor.
Show/Hide
Check whether or not to display CRCError, UnderSize, OverSize, Fragment, Jabber, Drop,
and SymbolErr errors.
Clear
Clicking this button clears all statistics counters on this window.
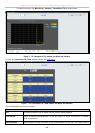
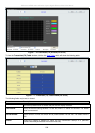
Clicking this button instructs the Switch to display a table rather than a line graph. View Table
Clicking this button instructs the Switch to display a line graph rather than a table. View Graphic
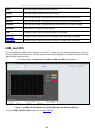
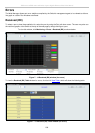
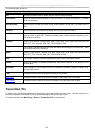
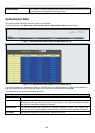
Transmitted (TX)
To select a port to view these statistics for, select the port by using the Port pull-down menu. The user may also use
the real-time graphic of the Switch at the top of the web page by simply clicking on a port.
To view this window, click Monitoring > Errors > Transmitted (TX) as shown below: