


20 Using McDATA Web Server
Fabric tree
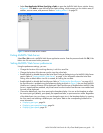
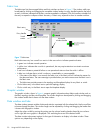
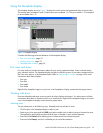
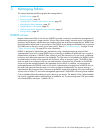
The fabric tree lists the managed fabrics and their switches as shown in Figure 7. The window width can
be adjusted by clicking and dragging the moveable window border. An entry handle located to the left of
an entry in the tree indicates that the entry can be expanded or collapsed. Click this handle or double-click
the entry to expand or collapse a fabric tree entry. A fabric entry expands to show its member switches.
Figure 7 Fabric tree
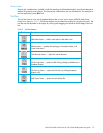
Each fabric tree entry has a small icon next to it that uses color to indicate operational status.
• A green icon indicates normal operation.
• A yellow icon indicates that a switch is operational, but may require attention to maintain maximum
performance.
• A red icon indicates a potential failure or non-operational state as when the switch is offline.
• A blue icon indicates that a switch is unknown, unreachable, or unmanageable.
• If the status of the fabric is not normal, the fabric icon in the fabric tree will indicate the reason for
the abnormal status. The same message is provided when you rest the mouse over the fabric icon in
the fabric tree.
• The fabric tree provides access to the topology and faceplate displays for any fabric or switch.
• Click a fabric entry in the fabric tree to open the topology display.
• Click a switch entry in the fabric tree to open the faceplate display.
Graphic window
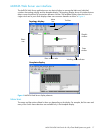
The graphic window, shown in Figure 4, presents graphic information about fabrics and switches such as
the fabric topology and the switch faceplate. The window height can be adjusted by clicking and dragging
the window border that it shares with the data window.
Data window and tabs
The data window presents a table of data and statistics associated with the selected tab. Use the scroll bar
to browse through the data. The window length can be adjusted by clicking and dragging the border that
it shares with the graphic window.
Adjust the column width by moving the pointer over the column heading border shared by two columns
until a right/left arrow graphic is displayed. Click and drag the arrow to the desired width.
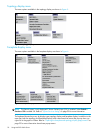
The data window tabs present options for the type of information to display in the data window. These
options vary depending on the display.
Switch
entries
Moveable
window border
Entry handle
Fabric entry