


Page 10-3
•Press ` to return to the PLOT - FUNCTION window. The expression
‘Y1(X) = EXP(-X^2/2)/√(2*π)’ will be highlighted. Press
L@@@OK@@@ to
return to normal calculator display.
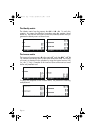
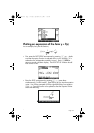
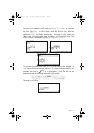
• Enter the PLOT WINDOW environment by entering
„ò (press
them simultaneously if in RPN mode). Use a range of –4 to 4 for H-
VIEW, then press
@AUTO to generate the V-VIEW automatically. The PLOT
WINDOW screen looks as follows:
• Plot the graph:
@ERASE @DRAW (wait till the calculator finishes the graphs)
• To see labels:
@EDIT L @LABEL @MENU
• To recover the first graphics menu: LL@)PICT
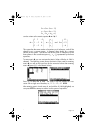
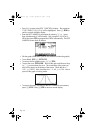
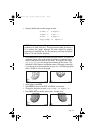
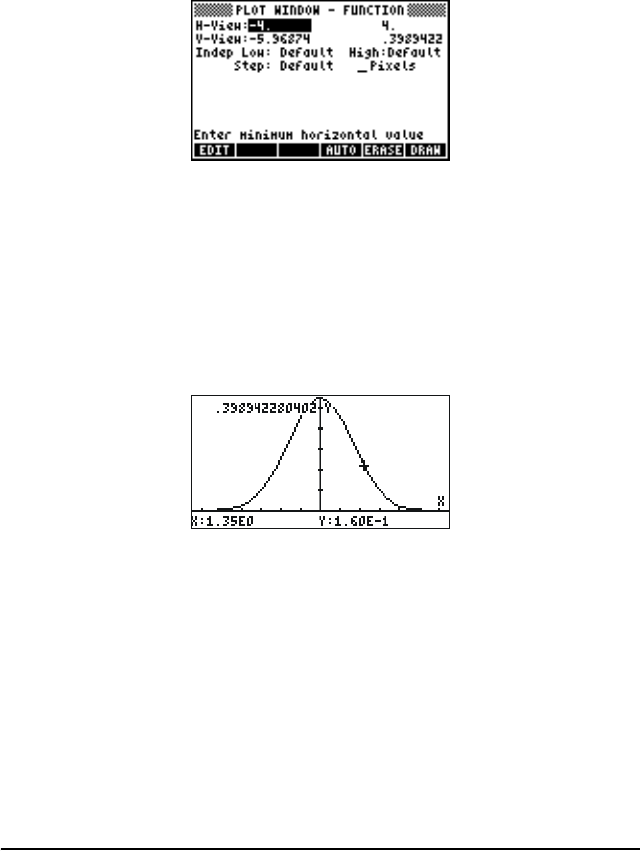
• To trace the curve: @TRACE @@X,Y@@ . Then use the right- and left-arrow keys
(
š™) to move about the curve. The coordinates of the points you
trace will be shown at the bottom of the screen. Check that for x =
1.05 , y = 0.0231. Also, check that for x = -1.48 , y = 0.134. Here is
picture of the graph in tracing mode:
• To recover the menu, and return to the PLOT WINDOW environment,
press
L@CANCL. Press L@@OK@@ to return to normal display.
SG49A.book Page 3 Friday, September 16, 2005 1:31 PM