


Page 10-6
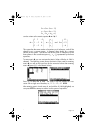
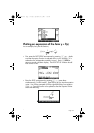
• Keep the default plot window ranges to read:
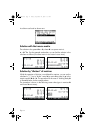
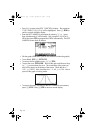
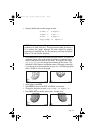
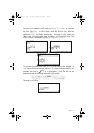
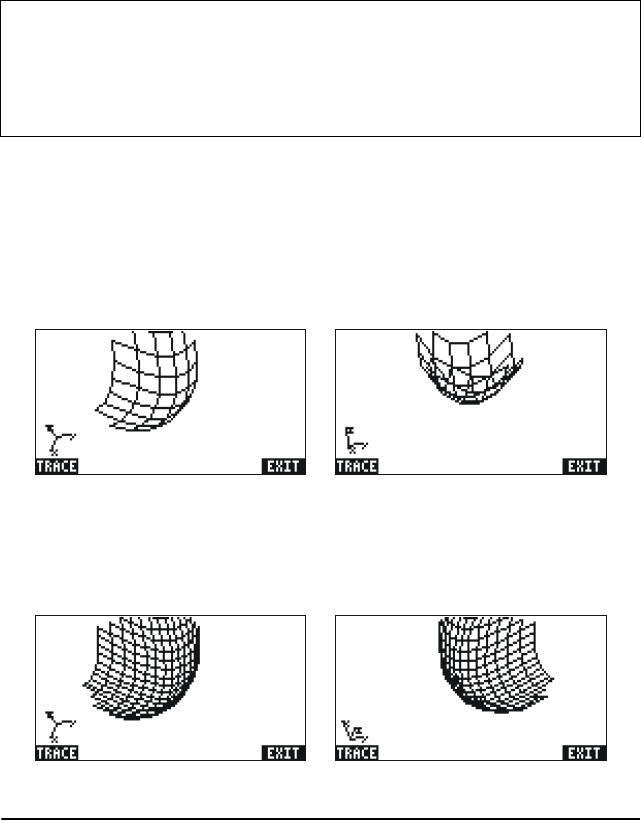
•Press @ERASE @DRAW to draw the three-dimensional surface. The result is a
wireframe picture of the surface with the reference coordinate system
shown at the lower left corner of the screen. By using the arrow keys
(
š™—˜) you can change the orientation of the surface. The
orientation of the reference coordinate system will change accordingly.
Try changing the surface orientation on your own. The following figures
show a couple of views of the graph:
• When done, press
@EXIT.
•Press
@CANCL to return to the PLOT WINDOW environment.
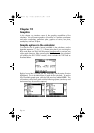
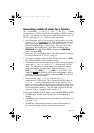
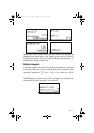
• Change the Step data to read:
Step Indep: 20 Depnd: 16
•Press @ERASE @DRAW to see the surface plot. Sample views:
X-Left:-1 X-Right:1
Y-Near:-1 Y-Far: 1
Z-Low: -1 Z-High: 1
Step Indep: 10 Depnd: 8
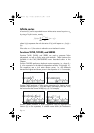
NOTE: The Step Indep: and Depnd: values represent the number of
gridlines to be used in the plot. The larger these number, the slower it
is to produce the graph, although, the times utilized for graphic
generation are relatively fast. For the time being we’ll keep the default
values of 10 and 8 for the Step data.
SG49A.book Page 6 Friday, September 16, 2005 1:31 PM