


Page 16-3
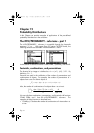
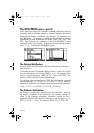
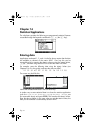
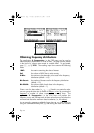
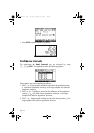
Obtaining frequency distributions
The application 2. Frequencies.. in the STAT menu can be used to
obtain frequency distributions for a set of data. The data must be present
in the form of a column vector stored in variable ΣDAT. To get started,
press
‚Ù˜@@@OK@@@. The resulting input form contains the following
fields:
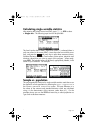
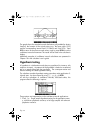
Given a set of n data values: {x
1
, x
2
, …, x
n
} listed in no particular order,
one can group the data into a number of
classes, or bins by counting the
frequency or number of values corresponding to each class. The
application
2. Frequencies.. in the STAT menu will perform this
frequency count, and will keep track of those values that may be below the
minimum and above the maximum class boundaries (i.e., the
outliers).
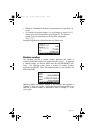
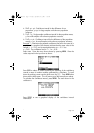
As an example, generate a relatively large data set, say 200 points, by
using the command RANM({200,1}), and storing the result into variable
ΣDAT: the matrix containing the data of interest.
Col: the column of ΣDAT that is under scrutiny.
X-Min: the minimum class boundary to be used in the frequency
distribution (default = -6.5).
Bin Count: the number of classes used in the frequency distribution
(default = 13).
Bin Width: the uniform width of each class in the frequency
distribution (default = 1).
SG49A.book Page 3 Friday, September 16, 2005 1:31 PM