


Page 16-6
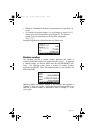
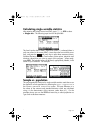
Level 3 shows the form of the equation. Level 2 shows the sample
correlation coefficient, and level 1 shows the covariance of x-y. For
definitions of these parameters see Chapter 18 in the user’s guide.
For additional information on the data-fit feature of the calculator see
Chapter 18 in the user’s guide.
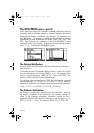
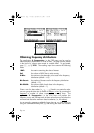
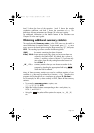
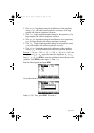
Obtaining additional summary statistics
The application 4. Summary stats.. in the STAT menu can be useful in
some calculations for sample statistics. To get started, press
‚Ù once
more, move to the fourth option using the down-arrow key
˜, and press
@@@OK@@@. The resulting input form contains the following fields:
Many of these summary statistics are used to calculate statistics of two
variables (x, y) that may be related by a function y = f(x). Therefore, this
program can be thought off as a companion to program
3. Fit data..
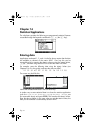
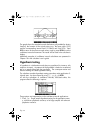
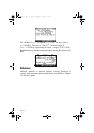
As an example, for the x-y data currently in ΣDAT, obtain all the summary
statistics.
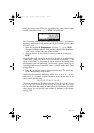
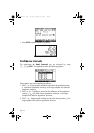
• To access the summary stats… option, use:
‚Ù˜˜˜@@@OK@@@
• Select the column numbers corresponding to the x- and y-data, i.e.,
X-Col: 1, and Y-Col: 2.
• Using the key select all the options for outputs, i.e., _ΣX, _ΣY,
etc.
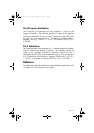
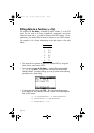
ΣDAT: the matrix containing the data of interest.
X-Col, Y-Col: these options apply only when you have more than two
columns in the matrix ΣDAT. By default, the x column is
column 1, and the y column is column 2. If you have only
one column, then the only setting that makes sense is to
have
X-Col: 1.
_ΣX _ ΣY…: summary statistics that you can choose as results of this
program by checking the appropriate field using
when that field is selected.
SG49A.book Page 6 Friday, September 16, 2005 1:31 PM