


Overview of Monitoring and Recovery
HP Integrity NonStop NS-Series Operations Guide—529869-005
3-7
Monitoring and Resolving Problems—An Approach
Monitoring and Resolving Problems—An
Approach
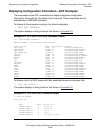
A useful approach to identifying and resolving problems in your system is to first use
OSM to locate the focal point of a hardware problem and then use SCF to gather all
the related data from the subsystems that control or act on the hardware. In this way,
you can develop a larger picture that encompasses the whole environment, including
communications links and other objects and services that might be contributing to the
problem or affected by it.
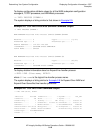
To get comprehensive online descriptions of all the available SCF commands, use the
SCF HELP command.
The following subsections give instructions for using OSM and SCF to monitor and
resolve problems.
Using OSM to Monitor the System
This section deals mostly with the OSM Service Connection, the primary OSM
interface for system monitoring and serviceability.
See Overview of OSM Applications on page 1-11 for examples of how the other OSM
applications are used for monitoring-related functions.
Using the OSM Service Connection
The OSM Service Connection can be used in a variety of ways to monitor your system,
including:
•
Use of colors and symbols to direct you to the source of any problems
•
Attribute values for system resources, displayed in the Attributes tab and in many
dialog boxes.
•
Alarms, displayed in the Alarms tab and Alarm Summary dialog box.
The following section presents one model for using the OSM Service Connection to
monitor your system, along with a few other options.
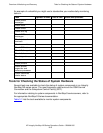
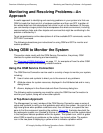
A Top-Down Approach
The Management (or main) window of the OSM Service Connection uses a series of
colors and symbols to notify you that problems exist within the system. You can tell at a
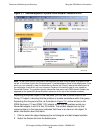
high-level glance when problem conditions exist, then drill-down, or expand the tree
pane to find the component reporting the problem. Figure 3-1 illustrates how both the
the rectangular system icon (located at the top of the view pane) and the system object
in the tree pane indicate problems within the system. The system icon, which is green
when OSM is reporting no problems on the system, has turned yellow. The system
icon in the tree pane is displaying a yellow arrow to indicate a problem within.