219
The Diagnostics pages are used for troubleshooting and are intended
primarily for the administrator of the KSX II device. All of the Diagnostics
pages (except Device Diagnostics) run standard networking commands
and the information that is displayed is the output of those commands.
The Diagnostics menu options help you debug and configure the network
settings.
The Device Diagnostics option is intended for use in conjunction with
Raritan Technical Support.
In This Chapter
Network Interface Page ......................................................................... 219
Network Statistics Page ......................................................................... 219
Ping Host Page ...................................................................................... 221
Trace Route to Host Page ..................................................................... 222
Device Diagnostics ................................................................................ 223
Network Interface Page
The KSX II provides information about the status of your network
interface.
To view information about your network interface:
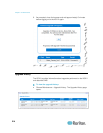
Choose Diagnostics > Network Interface. The Network Interface
page opens.
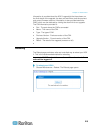
The following information is displayed:
Whether the Ethernet interface is up or down.
Whether the gateway is pingable or not.
The LAN port that is currently active.
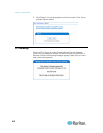
To refresh this information:
Click the Refresh button.
Network Statistics Page
The KSX II provides statistics about your network interface.
To view statistics about your network interface:
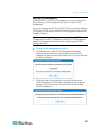
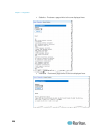
1. Choose Diagnostics > Network Statistics. The Network Statistics
page opens.
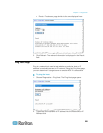
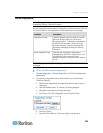
2. Choose the appropriate option from the Options drop-down list:
Chapter 11
Diagnostics


