8-10 LAN Interface Supplement
General Troubleshooting
Troubleshooting the Initial Connection
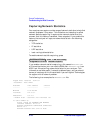
Capturing Network Statistics
Your analyzer can capture a wide range of network statistics to help find
network problems if they occur. This collection and recording is called
network statistic capturing. It captures the network statistics at the
moment that this feature is enabled, like a snapshot. If you enable this
feature, the analyzer will capture network statistics in the following
categories:
• TCP statistics
• IP statistics
• UDP statistics
• local routing table statistics
To enable network statistic capturing, press
If you enable network statistic capturing, a file named NETSTAT.CAP
will be maintained on your non-volatile RAM disk. NETSTAT.CAP is an
ASCII text file containing network statistics for your analyzer. This
information could be useful if network problems occur, and you should
have a printed copy of this file available if you call Agilent Technologies
for support with a network problem.
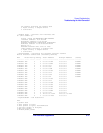
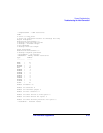
The following is an example of a NETSTAT.CAP file:
Logged Date: 1999/4/9 15:47:51
->hostShow - host names
hostname inet address aliases
-------- ------------ -------
HP871xE 15.4.45.2xx
localhost 127.0.0.1
nvBootLine 0.0.0.0
->ifShow "lo0" - statistic for interface lo0
lo (unit number 0):
Flags: (0x69) UP LOOPBACK ARP RUNNING
Internet address: 127.0.0.1
Netmask 0xff000000 Subnetmask 0xff000000
Metric is 0
Maximum Transfer Unit size is 4096
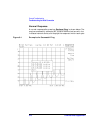
SYSTEM OPTIONS
LAN
LAN Port Setup
Diagnostic Utilities
Netstat Capture


