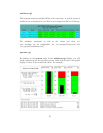
You can display different bar graphs by selecting different variables from the
drop down menus at the top of each of the three bar graphs.
As with multimon, if you have your local host configured in the
/etc/apcupsd/hosts.conf file, you can execute it from a Unix shell from the
source cgi directory as follows:
./upsstats.cgi:
As with multimon, quite a few lines of html should then be displayed.
upsfstatus.cgi:
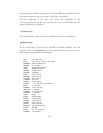
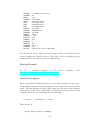
If you would like to see all of the STATUS variables available over the
network, click on the Data field of the desired system, and your browser
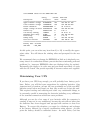
will display something like the following:
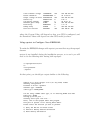
APC : 001,048,1109
DATE : Thu Dec 02 17:27:21 CET 1999
HOSTNAME : matou.sibbald.com
RELEASE : 3.7.0-beta-1
CABLE : Custom Cable Smart
MODEL : SMART-UPS 1000
UPSMODE : Stand Alone
UPSNAME : UPS_IDEN
LINEV : 223.6 Volts
MAXLINEV : 224.9 Volts
MINLINEV : 222.3 Volts
LINEFREQ : 50.0 Hz
OUTPUTV : 223.6 Volts
LOADPCT : 6.2 Percent Load Capacity
BATTV : 27.9 Volts
BCHARGE : 100.0 Percent
MBATTCHG : 5 Percent
TIMELEFT : 167.0 Minutes
MINTIMEL : 3 Minutes
SENSE : High
DWAKE : 060 Seconds
DSHUTD : 020 Seconds
LOTRANS : 196.0 Volts
HITRANS : 253.0 Volts
RETPCT : 050.0 Percent
STATFLAG : 0x08 Status Flag
STATUS : ONLINE
ITEMP : 35.1 C Internal
ALARMDEL : Low Battery
80


