


Several factors can be considered for a monitoring response:
What are relevant response methods? In other words, how will the response take Â
place?
What is the time to response? What is an acceptable interval between failure and Â
response?
What are the scaling considerations? Can the response plan work with all expected Â
(and even unexpected) frequencies of failure?
Are there testing monitoring systems in place? How do you know the monitoring Â
policy is catching the data you need, and how do you know the responses are
timely and appropriate? Have you tested the monitoring system recently?
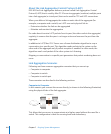
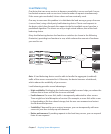
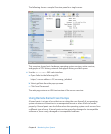
Using with Server Status Widget
The Server Status Dashboard widget is provided for quick access and
information about a single system. The Server Status widget lets you monitor
Mac OS X Server v10.6 activity from any computer with Mac OS X v10.6. Server Status
shows you graphs of processor activity, network load, disk usage, and whether the
service is polled hourly, daily, or weekly.
You can also see up to six running services and their status reports. By clicking on the
service, you can open Server Admin to the related service overview panel.
To congure the Server Status widget:
1 Add the widget to the Dashboard like any other widget.
2 Enter the server IP address or domain name.
3 Supply an administrative or monitoring login name and password.
4 Click Done.
To change the server address, login name, or password, click the information button (i)
at the top of the widget and change the settings.
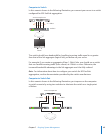
Using Server Monitor
The Server Monitor application can issue alerts via mail, cell phone, or pager
notication as soon as it detects critical problems. Built-in sensors detect and report
essential operating factors like power, temperature, and the condition of several key
components.
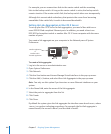
The Server Monitor interface allows you to quickly detect problems. In the main
window, Server Monitor lists each server on a separate line, with temperature
information and the status of each of its components, including fans, disk drives,
memory modules, power supplies, and Ethernet connections.
17 2 Chapter 8 Monitoring Your System