45-21
Catalyst 3750-E and 3560-E Switch Software Configuration Guide
OL-9775-02
Chapter 45 Troubleshooting
Using Debug Commands
When you run TDR, the switch reports accurate information if
• The cable for the Gigabit link is a solid-core cable.
• The open-ended cable is not terminated.
When you run TDR, the switch does not report accurate information if
• The cable for the Gigabit link is a twisted-pair cable or is in series with a solid-core cable.
• The link is a 10-Megabit or a 100-Megabit link.
• The cable is a stranded cable.
• The link partner is a Cisco IP Phone.
• The link partner is not IEEE 802.3 compliant.
Running TDR and Displaying the Results
When you run TDR on an interface, you can run it on the stack master or a stack member.
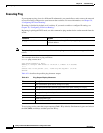
To run TDR, enter the test cable-diagnostics tdr interface interface-id privileged EXEC command:
To display the results, enter the show cable-diagnostics tdr interface interface-id privileged EXEC
command. For a description of the fields in the display, see the command reference for this release.
Using Debug Commands
These sections explains how you use debug commands to diagnose and resolve internetworking
problems:
• Enabling Debugging on a Specific Feature, page 45-21
• Enabling All-System Diagnostics, page 45-22
• Redirecting Debug and Error Message Output, page 45-22
Caution Because debugging output is assigned high priority in the CPU process, it can render the system
unusable. For this reason, use debug commands only to troubleshoot specific problems or during
troubleshooting sessions with Cisco technical support staff. It is best to use debug commands during
periods of lower network traffic and fewer users. Debugging during these periods decreases the
likelihood that increased debug command processing overhead will affect system use.
Note For complete syntax and usage information for specific debug commands, see the command reference
for this release.
Enabling Debugging on a Specific Feature
In Catalyst 3750-E switch stacks, when you enable debugging, it is enabled only on the stack master. To
enable debugging on a stack member, you must start a session from the stack master by using the session
switch-number privileged EXEC command. Then, enter the debug command at the command-line
prompt of the stack member.


