27-7
Cisco ASA Series Firewall ASDM Configuration Guide
Chapter 27 Configuring Threat Detection
Configuring Advanced Threat Detection Statistics
• Burst Threshold Rate—Sets the threshold for syslog message generation, between 25 and
2147483647. The default is 400 per second. When the burst rate is exceeded, syslog message 733104
is generated.
• Average Threshold Rate—Sets the average rate threshold for syslog message generation, between
25 and 2147483647. The default is 200 per second. When the average rate is exceeded, syslog
message 733105 is generated.
Click Set Default to restore the default values.
Step 6 Click Apply.
Monitoring Advanced Threat Detection Statistics
To monitor advanced threat detection statistics, perform one of the following tasks:
Path Purpose
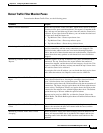
Home > Firewall Dashboard > Top 10 Access
Rules
Home > Firewall Dashboard > Top Usage
Statistics
Displays the top 10 statistics.
For the Top 10 Access Rules, permitted and denied traffic are not
differentiated in this display. In the Traffic Overview > Dropped Packets
Rate graph, you can track ACL denies.
The Top 10 Sources and Top 10 Destinations tabs show statistics for hosts.
Note: Due to the threat detction algorithm, an interface used as a
combination failover and state link could appear in the top 10 hosts; this
is expected behavior, and you can ignore this IP address in the display.
The Top 10 Services tab shows statistics for both ports and protocols (both
must be enabled for the display), and shows the combined statistics of
TCP/UDP port and IP protocol types. TCP (protocol 6) and UDP
(protocol 17) are not included in the display for IP protocols; TCP and
UDP ports are, however, included in the display for ports. If you only
enable statistics for one of these types, port or protocol, then you will only
view the enabled statistics.
The Top Ten Protected Servers under SYN Attack area shows the TCP
Intercept statistics. The display includes the top 10 protected servers
under attack. The detail button shows history sampling data. The ASA
samples the number of attacks 30 times during the rate interval, so for the
default 30 minute period, statistics are collected every 60 seconds.
From the Interval drop-down list, choose Last 1 hour, Last 8 hour, or
Last 24 hour.


