


498 Viewing Statistics and Remote Monitoring
•
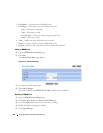
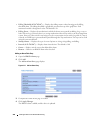
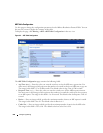
GVRP Statistics
— Selects GVRP Statistics when clicked, and specifies the type of GVRP statistics to
graph from the drop-down menu. The default is Join Empty - Receive.
•
Refresh Rate
— Selects the amount of time that passes before statistics are refreshed. The possible
field values are No Refresh, 15, 30 and 60 seconds. The default rate is No Refresh.
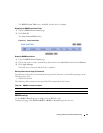
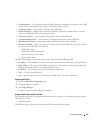
Displaying Port Statistics
1.
Open the
Ports Statistics
page.
2.
Select the port for which statistics will be charted.
3.
Click the radio button associated with the statistics to chart.
4.
Select the type of statistics from the related drop-down menu.
5.
Select the desired refresh rate from the
Refresh Rate
drop-down menu.
6.
Click
Draw
.
The selected statistics are charted on the graph.
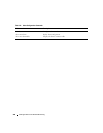
Viewing Port Statistics Using CLI Commands
For information about the CLI commands that perform this function, see the following chapters in the
CLI Reference Guide
:
• System Management Commands
• RMON Commands
• GVRP Commands
The following table summarizes the equivalent CLI commands for this feature.
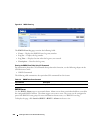
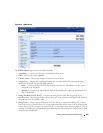
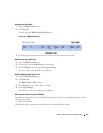
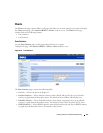
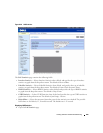
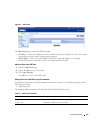
LAG Statistics
Use the LAG Statistics page to chart LAG-related statistics on a graph.
To display the page, click Statistics/RMON
→
Charts
→
LAGs in the tree view.
Table 8-13. Port Statistics Commands
CLI Command Description
show interfaces counters Display traffic seen by the interface.
show statistics ethernet Displays detailed statistics for a specific port or for the entire switch.
show rmon statistics Displays RMON Ethernet Statistics.
show gvrp statistics Displays GVRP statistics.