


Viewing Statistics
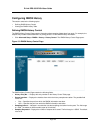
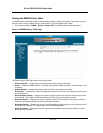
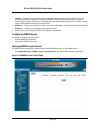
Managing RMON Statistics
Page 243
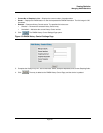
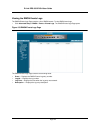
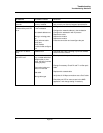
Defining RMON Alarms
The RMON Alarm Page contains fields for setting network alarms. Network alarms occur when a network
problem, or event, is detected. Rising and falling thresholds generate events. To set RMON alarms:
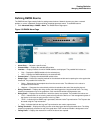
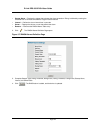
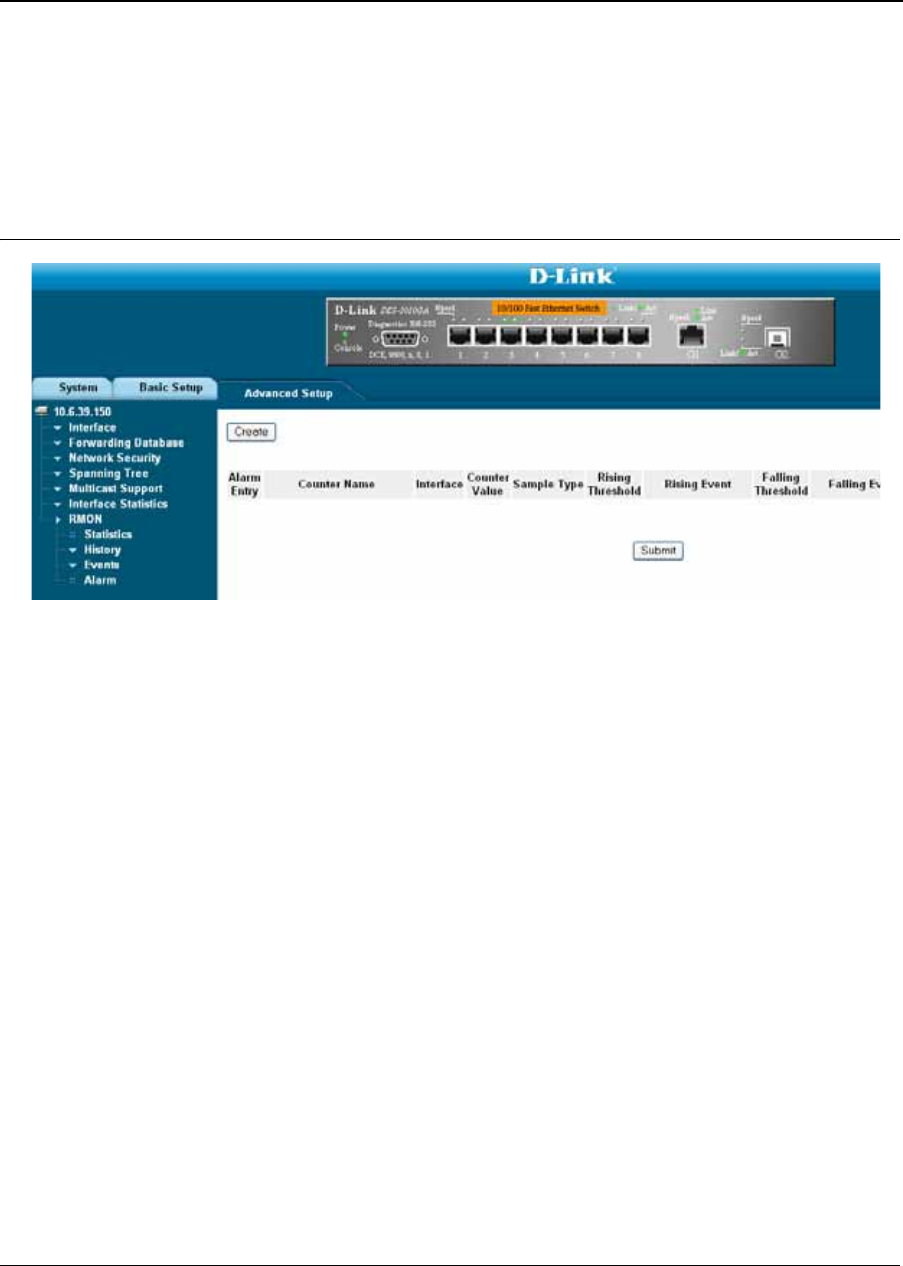
1. Click Advanced Setup > RMON > Alarm. The RMON Alarm Page opens.
Figure 156:RMON Alarm Page
The RMON Alarm Page contains the following fields:
• Alarm Entry — Indicates a specific alarm.
• Counter Name — Displays the selected MIB variable.
• Interface — Displays interface for which RMON statistics are displayed. The possible field values are:
– Port — Displays the RMON statistics for the selected port.
– LAG — Displays the RMON statistics for the selected LAG.
• Counter Value — Displays the selected MIB variable value.
• Sample Type — Defines the sampling method for the selected variable and comparing the value against the
thresholds. The possible field values are:
– Delta — Subtracts the last sampled value from the current value. The difference in the values is
compared to the threshold.
– Absolute — Compares the values directly with the thresholds at the end of the sampling interval.
• Rising Threshold — Displays the rising counter value that triggers the rising threshold alarm. The rising
threshold is presented on top of the graph bars. Each monitored variable is designated a color.
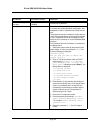
• Rising Event — Displays the mechanism in which the alarms are reported. The possible field values are:
– LOG — Indicates there is not a saving mechanism for either the device or in the management system. If
the device is not reset, the entry remains in the Log Table.
– TRAP — Indicates that an SNMP trap is generated, and sent via the Trap mechanism. The Trap can also
be saved using the Trap mechanism.
– Both— Indicates that both the Log and Trap mechanism are used to report alarms.
• Falling Threshold — Displays the falling counter value that triggers the falling threshold alarm. The falling
threshold is graphically presented on top of the graph bars. Each monitored variable is designated a color.
• Falling Event — Displays the mechanism in which the alarms are reported.