


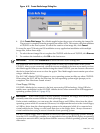
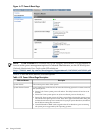
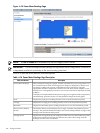
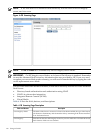

Figure 6-18 Power Meter Readings Page
NOTE: The BL c-Class tab is available only on HP Integrity server blades.
IMPORTANT: Power consumption data readings are dependent on the configuration, architecture,
components, and levels of activity of the server at any given time.
Table 6-16 lists the fields, buttons, and descriptions.
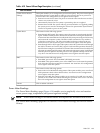
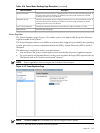
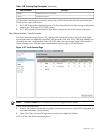
Table 6-16 Power Meter Readings Page Description
DescriptionFields and Buttons
Data is displayed using a bar graph. Each bar represents the power usage taken over
a five minute interval. Peak and average power usage are displayed by default. You
can display or hide peak, average, and minimum power samples by using the
appropriate checkbox. Samples are collected over a 24–hour period. Samples are not
retained over a management processor or server reset. Data can be displayed in Watts
or Btu/hr.
To display a tool tip that indicates the power usage, power regulator mode, temperature,
and timestamp, pause the mouse over the particular sample on the bar graph.
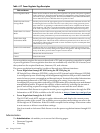
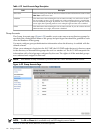
Power Meter Readings
Displays the peak power reading from the server over the last 24-hour period.Peak
Displays the average power reading from the server over the last 24-hour period.Average
Displays the minimum power reading from the server over the last 24-hour period.Minimum
The 24-hour History section displays the average, maximum, and minimum power
averages. The peak and minimum samples are recorded along with the average of the
averages from the 24-hour time period.
24-hour Power History
Section
Displays the average of the power readings from the server over the last 24-hour period.
If the server has not been running for 24 hours, the value is the average of all the
readings since the server was booted.
Average Power
106 Using iLO 2 MP