


120 Storage Management with DB2 for OS/390
Statistics and accounting traces are collected in most installations. A
performance trace is collected when a specific problem has to be investigated.
Activating the performance trace has a significant impact on DB2 subsystem
performance. The user can cause more or less information to be collected by
these traces, by specifying trace classes to be activated.
An accounting trace provides information at an identifier level. Examples of
identifiers are plans, packages, users, or connection types. Accounting
information can be a summary of multiple executions (Accounting Report), or it
can be a detail of every execution (Accounting Trace).
A statistics trace provides information at DB2 subsystem level. It can be a
summary of multiple statistic intervals (Statistics Report) or it can be a listing of
each interval (Statistics Trace).
The performance trace can generate detailed information on all DB2 subsystem
activity. When this trace has been started with the appropiate classes, DB2 PM
can generate an I/O activity report.
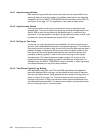
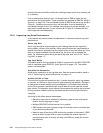
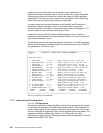
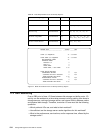
Figure 43. Installation Panel DSNTIPN
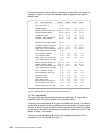
11.1.1 Accounting I/O Information
11.1.1.1 I/O Operations
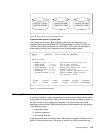
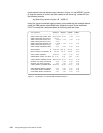
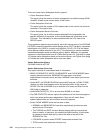
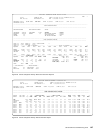
The data I/O operations initiated by DB2 on behalf of an application are detailed
in the buffer pool sections of the DB2 PM accounting report. Each bufferpool is
shown independently. For an example, see Figure 44 on page 121. Every read
access is reported as a getpage. Every write is reported as a buffer update. The
getpages and buffer updates may initiate an I/O. These I/Os are either
synchronous or asynchronous. The asynchronous reads are reported in the three
prefetch fields (SEQ, LIST, DYN).
DSNTIPN UPDATE DB2 - TRACING AND CHECKPOINT PARAMETERS
===>
Enter data below:
1 AUDIT TRACE ===> NO Audit classes to start. NO,YES,list
2 TRACE AUTO START ===> NO Global classes to start. YES, NO, list
3 TRACE SIZE ===> 64K Trace table size in bytes. 4K-396K
4 SMF ACCOUNTING ===> 1 Accounting classes to start. NO,YES,list
5 SMF STATISTICS ===> YES Statistics classes to start. NO,YES,list
6 STATISTICS TIME ===> 30 Time interval in minutes. 1-1440
7 DATASET STATS TIME ===> 5 Time interval in minutes. 1-1440
8 MONITOR TRACE ===> NO Monitor classes to start. NO, YES, list
9 MONITOR SIZE ===> 8K Default monitor buffer size. 8K-1M
10 CHECKPOINT FREQ ===> 50000 Number of log records per checkpoint
11 UR CHECK FREQ ===> 0 Checkpoints to enable UR check. 0-255
12 LIMIT BACKOUT ===> AUTO Limit backout processing. AUTO,YES,NO
13 BACKOUT DURATION ===> 5 Checkpoints processed during backout if
LIMIT BACKOUT = AUTO or YES. 0-255.
14 RO SWITCH CHKPTS ===> 5 Checkpoints to read-only switch. 1-32767
15 RO SWITCH TIME ===> 10 Minutes to read-only switch. 0-32767
16 LEVELID UPDATE FREQ ===> 5 Checkpoints between updates. 0-32767
F1=HELP F2=SPLIT F3=END F4=RETURN F5=RFIND F6=RCHANGE
F7=UP F8=DOWN F9=SWAP F10=LEFT F11=RIGHT F12=RETRIEVE