


124 Storage Management with DB2 for OS/390
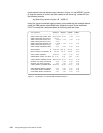
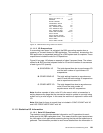
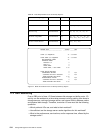
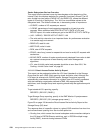
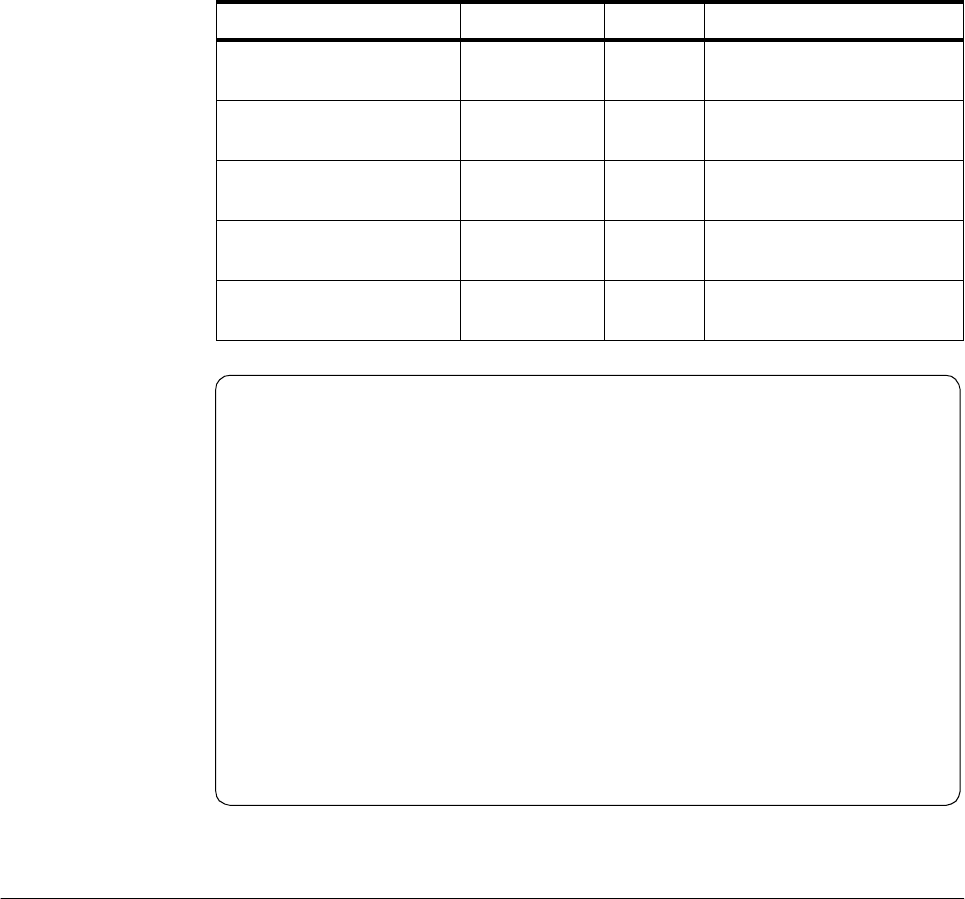
Table 26. Trace Requirement for the I/O Activity Reports
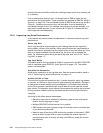
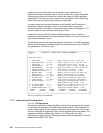
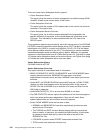
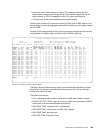
Figure 47. Buffer Pool Section from I/O Activity Summary Report
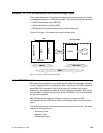
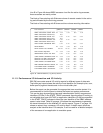
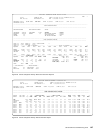
11.2 RMF Monitoring
From a DB2 point of view, I/O flows between disk storage and buffer pools. I/O
activity can be modeled as a three-step process involving pathing from hosts to
storage servers, caching of storage server, and internal activity between cache
and physical disk storage. Therefore, to monitor I/O one must ask the following
questions:
• Which paths do I/Os use, and what is their workload?
• How efficient are the storage server cache algorithms for this workload?
• What is the performance, service time, and/or response time, offered by the
storage server?
I/O Activity Report DB2 Trace Class IFCID
Buffer Pool Performance
4 6, 7, 8, 9, 10, 105, 107
EDM Pool Performance
4 29, 30, 105, 107
Active Log Performance
5 34, 35, 36, 37, 38, 39
Archive Log/BSDS Performance
5 34, 35, 36, 37, 40, 41,
114, 115, 116, 119, 120
Cross Invalidation Performance
21 105, 107, 255
BUFFER POOL TOTALS AET
---------------------------- -------- ---------
TOTAL I/O REQUESTS 51 0.019885
TOTAL READ I/O REQUESTS 51 0.019885
NON-PREFETCH READS 51
PREFETCH READS
WITHOUT I/O 0
WITH I/O 0
PAGES READ 0
PAGES READ / SUCC READ 0.00
TOTAL WRITE REQUESTS 0
SYNCHRONOUS WRITES 0 N/C
COUPLING FACILITY CASTOUTS 0 N/C
PAGES WRITTEN PER WRITE 0.00
ASYNCHRONOUS WRITES 0 N/C
COUPLING FACILITY CASTOUTS 0 N/C
PAGES WRITTEN PER WRITE 0.00