


I/O Performance and Monitoring Tools 137
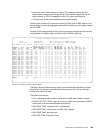
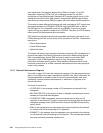
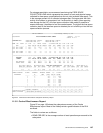
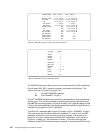
For storage specialists, we recommend monitoring the FREE SPACE
COLLECTION LOAD which represents the amount of back-end physical space
collected for free space consolidation that did not yield available free space. This
is the average percent full of collected storage areas. During periods with little
activity this number is unimportant; but if write activity is heavy (thus requiring
new storage for the LSF), the free space collection load makes it possible to
assess how easy it has been to free the needed space. The higher the free space
collection load is, the less free space is obtained per unit of effort put into the free
space collection process.
Figure 54. IXFP Device Performance Subsystem Summary Report
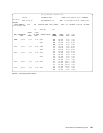
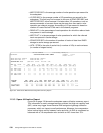
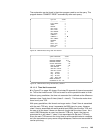
11.3.2 Cache Effectiveness Report
Figure 55 on page 138 shows the subsystem summary of the Cache
Effectiveness report. Most of the fields provide a good indicator of the RVA
workload.
The fields to review are as follows:
• READ PER SEC is the average number of read operations per second to the
subsystem.
IBM ITSO POKEEPSIE 17:30 Thursday, February 18, 1999
XSA/REPORTER DEVICE PERFORMANCE OVERALL SUMMARY 18FEB1999 17:31:24
SIBDPIO V2 R1 L1
SUBSYSTEM 20395 REPORT START DATE: 17FEB1999 REPORT END DATE: 17FEB1999
REPORT START TIME: 15:16 REPORT END TIME: 15:54
FDID DEV VOLSER T/P % DEV I/O KBYTES ACCESS -I/O SERVICE TIME (MS)- % DEV % DEV % DEV
ADDR AVAIL PER SEC PER SEC DENSITY TOTAL DISC CONNECT UTIL DISC CONN
---- ---- -------- --- ----- ------- ------- ------- ----- ------ ------- ----- ----- -----
0000 2B00 RV2B00 P 100.0 4.2 549.9 1.5 33.8 8.6 25.2 14.3 3.6 10.7
0001 2B01 RV2B01 P 100.0 0.0 0.0 0.0 0.8 0.0 0.8 0.0 0.0 0.0
00FE 2BFE RV2BFE P 100.0 0.0 0.0 0.0 0.0 0.0 0.0 0.0 0.0 0.0
00FF 2BFF RV2BFF P 100.0 0.0 0.0 0.0 0.0 0.0 0.0 0.0 0.0 0.0
===================================================================================================================================
SUBSYSTEM %DEV I/O KBYTES ACCESS -I/O SERVICE TIME (MS)- % DEV % DEV % DEV
SUMMARY AVAIL PER SEC PER SEC DENSITY TOTAL DISC CONNECT UTIL DISC CONN
----- ------- ------- ------- ----- ------ ------- ----- ----- -----
PROD PARTITION 100.0 45.7 5481.4 0.1 30.5 7.3 23.3 0.5 0.1 0.4
OVERALL TOTALS 100.0 45.7 5481.4 0.1 30.5 7.3 23.3 0.5 0.1 0.4
AVG % DRIVE COEFF OF NET CAPACITY LOAD % FREE SPACE COLLECTION LOAD COLL FREE SPC (%) UNCOLL FREE SPC (%)
MODULE UTIL VARIATION TEST PROD OVERALL TEST PROD OVERALL TEST PROD OVERALL TEST PROD OVERALL
---------------------- ----- ----- ------- ----- ----- ------- ----- ----- ------- ----- ----- -------
10.6 78 0.0 56.4 56.4 0.0 0.0 0.0 0.0 42.4 42.4 0.0 1.2 1.2
====================================================================================================================================
CHANNEL INTERFACE CLUSTER INTERFACE INTERFACE CHANNEL I/O % ACTIVE
PERFORMANCE ID NAME SPEED PER SEC ON CHNL
------- --------- --------- ------- ------- --------
0 A 20.0 5.8 14330
0 C 20.0 5.7 7172
0 I 20.0 5.7 14330
0 K 20.0 5.7 14330
1 A 20.0 5.7 14330
1 C 20.0 5.7 14330
1 I 20.0 5.7 13.4
1 K 20.0 5.7 13.3
-====================================================================================================================================
0 »----------------------------»------»------»------»------»------»------»------»------»------»------»
» FREQUENCY (PERCENTILE) » 10 » 20 » 30 » 40 » 50 » 60 » 70 » 80 » 90 » 100 »
DISTRIBUTION OF DRIVE»----------------------------»------»------»------»------»------»------»------»------»------»------»
MODULE UTILIZATION » % DRIVE MODULE UTILIZATION » 10.4 » 10.4 » 10.5 » 10.5 » 10.6 » 10.6 » 10.6 » 10.7 » 10.8 » 11.1 »
»----------------------------»------»------»------»------»------»------»------»------»------»------»