154 Storage Management with DB2 for OS/390
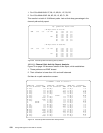
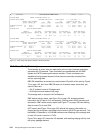
Figure 74. Case Study IXFP Space Utilization Summary Extract
12.3 Case Study Summary
The summary is driven from the application point of view, because application
generates the I/O demand. Then correlations are established with the RMF
system and IXFP harware performance monitors. Those correlations are
established using spread sheets of which data are manually extracted from
various reporting tools.
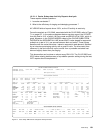
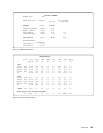
DB2 PM establishes an exclusively read oriented I/O profile of the activity. Figure
75 on page 155, built from DB2 PM data out of several areas, shows that, per
second, there are:
• 84.37 prefetch reads of 32 pages each
• 8.65 synchronous reads of one page
The average wait on request is 8.8 millisecond.
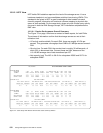
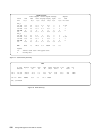
RMF device activity report, see Figure 76 on page 155, shows consistent
information for I/O rate of 91.0 and queuing. Queing covers IOSQ, pending and
disconnect. RMF cache activity report (see Figure 77 on page 156) has missing
data for one LCU of each RVA.
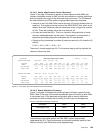
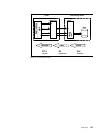
IXFP report (see Figure 78 on page 156) affords the missing information on
staging activity and gives a consistent view of activity (90.2 I/Os per second). The
bandwidth I/O demand of 10.518 MB/s allows cross-checking of the average size
of each I/O, which is around 117 KB.
Figure 79 on page 157 shows the I/O requests, and resulting staging activity, from
the query getpage demand.
XSA/REPORTER SPACE UTILIZATION SUMMARY REPORT 17FEB1999 16:47:05
SUBSYSTEM 20395 (NUMBER OF FUNCTIONAL DEVICES: 256)
SELECTED DEVICES SUMMARY FUNCTIONAL CAPACITY (MB) % FUNCT CAPACITY -------- DISK ARRAY --------
SELECTED TOTAL FUNCTIONAL NOT NOT -- PHYSICAL CAP USED (MB) -- COMP
DEVICES CAPACITY (MB) STORED STORED STORED STORED SHARED UNIQUE TOTAL RATIO
-------- ------------- --------- --------- ------ ------ -------- -------- -------- -----
PRODUCTION PARTITION: 256 726532.2 204036.4 522495.8 28.1 71.9 0.0 65964.1 65964.1 3.1
TOTALS: 256 726532.2 204036.4 522495.8 28.1 71.9 0.0 65964.1 65964.1 3.1
SUBSYSTEM 20395 SPACE UTILIZATION SUMMARY
NUMBER OF DISK ARRAY NET CAPACITY LOAD(%) COLL FREE SPACE (%) UNCOLL FREE SPACE(%)
FUNCTIONAL DEVICES CAPACITY (MB) TEST PROD OVERALL TEST PROD OVERALL TEST PROD OVERALL
------------------ ------------- ----- ----- ------- ----- ----- ------- ----- ----- -------
256 117880.2 0.0 56.4 56.4 0.0 42.4 42.4 0.0 1.3 1.3
SUBSYSTEM 22897 (NUMBER OF FUNCTIONAL DEVICES: 256)
SELECTED DEVICES SUMMARY FUNCTIONAL CAPACITY (MB) % FUNCT CAPACITY -------- DISK ARRAY --------
SELECTED TOTAL FUNCTIONAL NOT NOT -- PHYSICAL CAP USED (MB) -- COMP
DEVICES CAPACITY (MB) STORED STORED STORED STORED SHARED UNIQUE TOTAL RATIO
-------- ------------- --------- --------- ------ ------ -------- -------- -------- -----
PRODUCTION PARTITION: 256 726532.2 39125.9 687406.3 5.4 94.6 0.0 20157.3 20157.3 1.9
TOTALS: 256 726532.2 39125.9 687406.3 5.4 94.6 0.0 20157.3 20157.3 1.9
SUBSYSTEM 22897 SPACE UTILIZATION SUMMARY
NUMBER OF DISK ARRAY NET CAPACITY LOAD(%) COLL FREE SPACE (%) UNCOLL FREE SPACE(%)
FUNCTIONAL DEVICES CAPACITY (MB) TEST PROD OVERALL TEST PROD OVERALL TEST PROD OVERALL
------------------ ------------- ----- ----- ------- ----- ----- ------- ----- ----- -------
256 81609.4 0.0 25.2 25.2 0.0 73.9 73.9 0.0 0.9 0.9


