


Case Study 155
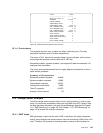
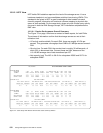
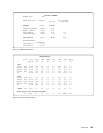
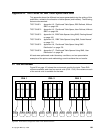
Figure 75. DB2PM I/O Summary
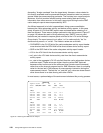
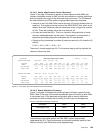
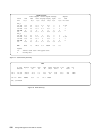
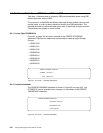
Figure 76. Device Activity Summary
DB2 PM I/O SUMMARY
Elapsed (sec): 2260
BUFFER POOL Tot4K requests wait / request
per sec ms per read
getpages 6135875 2714.52
synchronous prefetch 164649 72.84
dynamic prefetch 26065 11.53
total prefetch 190714 84.37 9.4
synchronous reads 19559 8.65 2.9
Total read I/O 210273 93.03 8.8
ACCOUNTING CLASS 3
elapsed sec
Synchronous I/O 56.77
Other Read I/O 1799.16
DEVICE ACTIVITY
CU-ID rate resp_t iosq pend disc conn path queing
ssch/sec ms ms ms ms ms % ms
RVA_1
1st LCU 2B00 15.778 31.8 0.0 0.2 7.1 24.5 38.7 7.3
2nd LCU 2B40 8.752 33.6 2.0 0.2 6.7 24.7 21.6 8.9
3rd LCU 2B80 14.145 27.2 1.0 0.2 5.4 20.6 29.1 6.6
4th LCU 2BC0 7.923 31.9 0.0 0.2 7.0 24.7 19.6 7.2
tot 46.598 30.8 0.7 0.2 6.5 23.4 109.0 7.4
RVA_2
1st LCU 2C00 3.721 33.7 0.0 0.2 9.3 24.2 9.0 9.5
2nd LCU 2C40 14.431 26.3 2.0 0.2 6.3 17.8 25.7 8.5
3rd LCU 2C80 14.540 34.4 0.0 0.2 9.1 25.1 36.5 9.3
4th LCU 22C0 11.668 30.1 0.0 0.2 7.6 22.3 26.0 7.8
tot 44.360 30.6 0.7 0.2 7.8 21.9 97.2 8.7
System 71C0 6.963 3.1 0.0 0.4 0.1 2.6 1.8 0.5
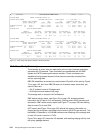
Device Activity with Storage Group Report
SG 91.0 31.0 1.0 0.2 7.1 22.7 206.5 8.3