87
• Right-click anywhere in the background of the Topology window. Select Refresh Fabric from the pop-
up menu.
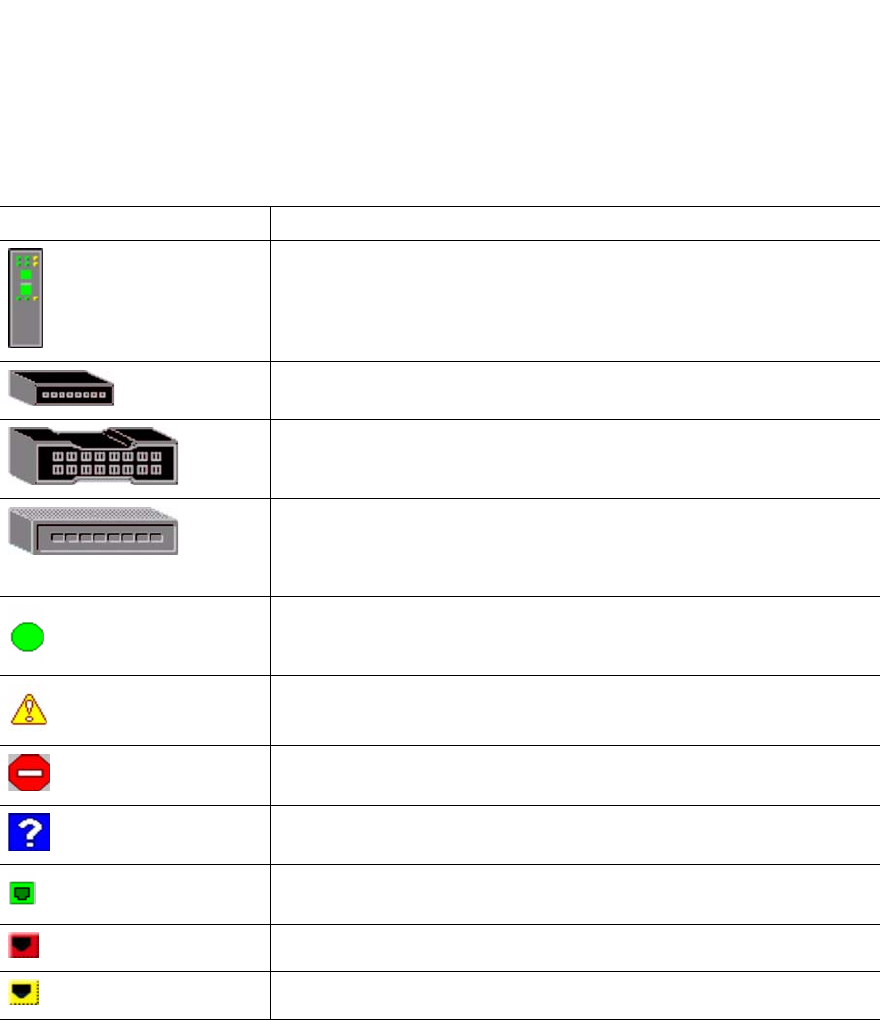
The Topology window displays switch module and status icons that provide status information about switches,
interswitch links, and the Ethernet connection. The switch module icons indicate different vendor switches and
switch types. The switch module status icons, displayed on the left side of a switch, vary in shape and color.
Each switch module that is managed by an Ethernet Internet protocol (IP) has a colored Ethernet icon that is
displayed on the right side of the switch. A green Ethernet icon indicates normal operation, amber indicates
operational with errors, and red indicates inactive or failure. Table 17 on page 87 shows the different switch
module icons and their descriptions.
✏ NOTE
Different switch module icons are displayed depending on the different switch vendor products
presented in the attached fabric. For a list of switch module icons and vendors, see Table 17 Attached
switch modules that are not manageable through the SAN Utility are displayed as third-party
manageable switch icons. The topology configuration in Figure 6 on page 80 shows an example of a
switch fabric with third-party switch modules.
Table 17. Topology window switch module and status icons
Switch module icon Description
Fibre Channel switch module
QLogic* 8-port Fibre Channel switch module
QLogic16-port Fibre Channel switch module
Inrange switch module
McData switch module
Brocade switch module
Other third-party switch modules
Switch communication normal (green)
Switch is operational with errors (amber)
Switch communication interrupted (red)
Switch management communication unknown (blue)
Fabric management switch Ethernet connection normal (green)
Fabric management switch Ethernet connection critical (red)
Fabric management switch Ethernet connection warning (amber)


